Palmyra: Fire Incidents, New York (NY)
Where are fire incidents reported in Palmyra, NY
Something went wrong! Please refresh the page.
|
| |||||||||||||||||||||||||||||||||||||||||||||||||||||||||||||||||||||||||||||||||||||||||||||||||||||||||||||
2002 - 2018 National Fire Incident Reporting System (NFIRS) incidents
- Incident types reported to NFIRS in Palmyra, NY
- 38426.1%Hazardous Condition
- 32021.7%Service Call
- 27418.6%Rescue & EMS
- 25317.2%False Alarm
- 1238.4%Fire
- 896.0%Good Intent Call
- 241.6%Severe Weather
- 40.3%Special Incident
- 20.1%Overpressure Rupture
- Fire incident types reported to NFIRS in Palmyra, NY
- 10585.4%Structure Fires
- 1411.4%Outside Fires
- 21.6%Mobile Property/Vehicle Fires
- 21.6%Other
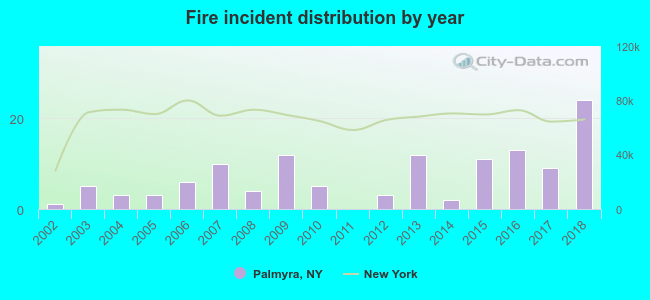 Based on the data from the years 2002 - 2018 the average number of fires per year is 7. The highest number of reported fire incidents - 24 took place in 2018, and the least - 0 in 2011. The data has a rising trend.
 30.1% incidents where reported in the morning and 69.9% in the evening. The most fires (22.0%) took place on Friday, and the least (7.3%) on Tuesday.
 Based on the 123 fire incident reports from years 2002 - 2018 most fires (13.8%) took place during April, and the least (3.3%) in October.
 Out of all 1,473 cases reported during the years 2002 - 2018, the most belonged to the categories: Hazardous Condition (26.1%), Service Call (21.7%), and Rescue & EMS (18.6%).
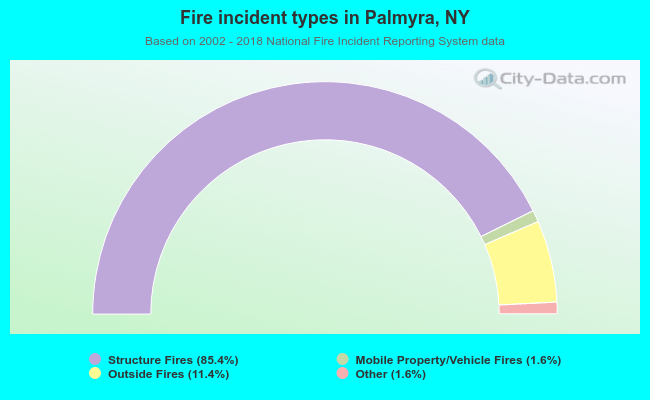 When looking into fire subcategories, the most reports belonged to: Structure Fires (85.4%), and Outside Fires (11.4%).