Paoli: Fire Incidents, Indiana (IN)
Where are fire incidents reported in Paoli, IN
Something went wrong! Please refresh the page.
|
| |||||||||||||||||||||||||||||||||||||||||||||||||||||||||||||||||||||||||||||||||||||||||||||||||||||||||||||
| Other | 13 | |||||||||||||||||||||||||||||||||||||||||||||||||||||||||||||||||||||||||||||||||||||||||||||||||||||||||||||
2002 - 2018 National Fire Incident Reporting System (NFIRS) incidents
- Incident types reported to NFIRS in Paoli, IN
- 39147.7%Fire
- 30437.1%Rescue & EMS
- 769.3%Hazardous Condition
- 313.8%Good Intent Call
- 151.8%Service Call
- 10.1%False Alarm
- 10.1%Severe Weather
- Fire incident types reported to NFIRS in Paoli, IN
- 19148.8%Structure Fires
- 12231.2%Outside Fires
- 4712.0%Mobile Property/Vehicle Fires
- 317.9%Other
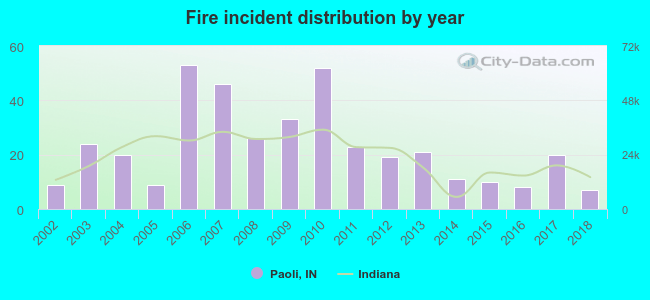 Based on the data from the years 2002 - 2018 the average number of fires per year is 23. The highest number of reported fire incidents - 53 took place in 2006, and the least - 7 in 2018. The data has a declining trend.
 35.0% incidents where reported in the morning and 65.0% in the evening. The most fires (22.3%) took place on Saturday, and the least (8.7%) on Monday.
 Based on the 391 incident reports from years 2002 - 2018 most fires (13.6%) took place during March, and the least (3.8%) in December.
 Out of all 819 cases reported during the years 2002 - 2018, the most belonged to the categories: Fire (47.7%), Overpressure Rupture (37.1%), and Rescue & EMS (9.3%).
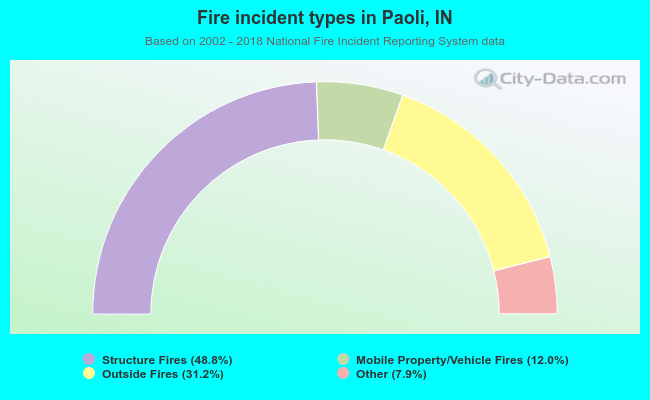 When looking into fire subcategories, the most incidents belonged to: Structure Fires (48.8%), and Outside Fires (31.2%).