| Fire incidents reported |
|---|
| Sreet name | Count |
|---|
| HIGHWAY 133 | 20 | | 133 HWY | 14 | | MATHEWS LN | 10 | | CRAWFORD RD. | 8 | | STUCKER MESA RD | 8 | | BLACK BRIDGE RD | 6 | | BONE MESA RD | 6 | | GRAND AVE | 6 | | LAMBORN MESA RD. | 6 | | MINNESOTA CREEK RD | 6 | | MINNESOTA CREEK RD. | 6 | | O RD | 6 | | 3700 RD. | 4 | | 3RD ST | 4 | | 4TH ST. | 4 | | BELL CREEK RD | 4 | | BOWIE RD | 4 | | FARMERS MINE RD | 4 | | FIRE MOUNTAIN RD. | 4 | | GRANGE RD | 4 | | GRANGE RD | 4 | | HUBBARD CREEK RD | 4 | | L75 RD. | 4 | | MINNESOTA CREEK RD | 4 | | PEACEFUL LN | 4 |
| | | Fire incidents reported |
|---|
| Sreet name | Count |
|---|
| STAHL RD. | 4 | | STUCKER MESA | 4 | | STUCKER MESA RD | 4 | | SUNSHINE MESA RD | 4 | | 14340 CRESTHAVEN RD | 2 | | 14755 CANYON RD | 2 | | 16451 GRANGE RD | 2 | | 187 HWY | 2 | | 221 ORCHARD AVE | 2 | | 3 ST | 2 | | 3700 RD | 2 | | 3700 RD | 2 | | 3740 DR | 2 | | 3740 RD | 2 | | 3750 RD | 2 | | 3790 RD. | 2 | | 3800 RD | 2 | | 39007 L 75 RD | 2 | | 39696 MATHEWS LN | 2 | | 3RD ST. | 2 | | 4 MILES NORTH OF HIGHWAY 133 | 2 | | 400 BLOCK OF NIAGRA AVE. ALY | 2 | | 4050 RD. | 2 | | 4TH ST | 2 | | |
|
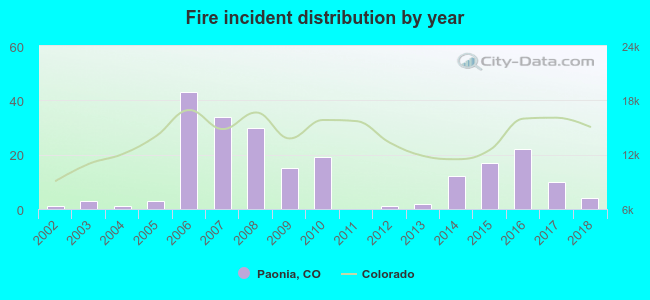 Based on the data from the years 2002 - 2018 the average number of fire incidents per year is 13. The highest number of reported fires - 43 took place in 2006, and the least - 0 in 2011. The data has a rising trend.
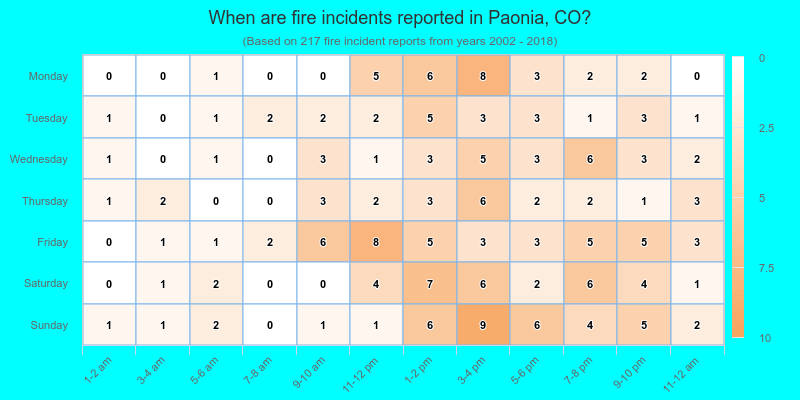
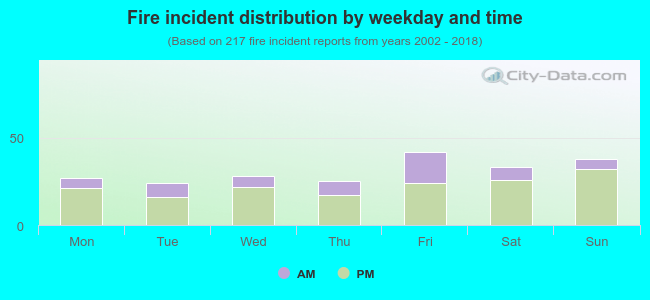 27.2% incidents where reported in the morning and 72.8% in the evening. The most fires (19.4%) took place on Friday, and the least (11.1%) on Tuesday.
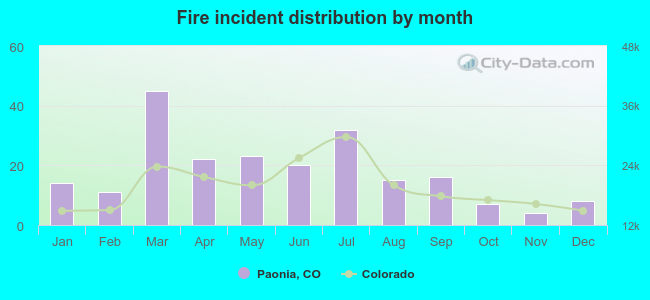 Based on the 217 fire incidents from years 2002 - 2018 most fires (20.7%) took place during March, and the least (1.8%) in November.
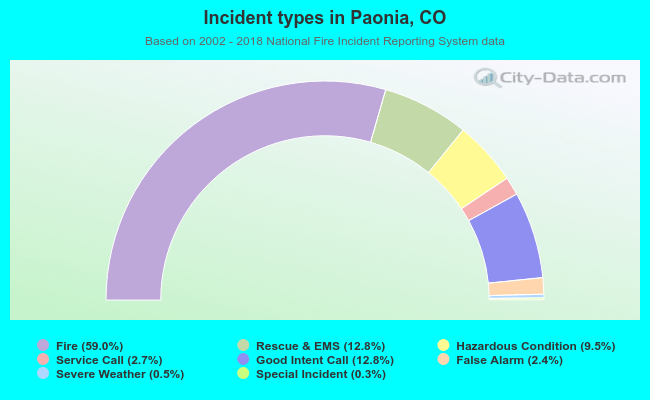 Out of all 368 cases reported during the years 2002 - 2018, the most belonged to the categories: Fire (59.0%), Overpressure Rupture (12.8%), and Service Call (12.8%).
 When looking into fire subcategories, the most incidents belonged to: Outside Fires (61.8%), and Structure Fires (25.8%).