Paramus: Fire Incidents, New Jersey (NJ)
Where are fire incidents reported in Paramus, NJ
Something went wrong! Please refresh the page.
|
| |||||||||||||||||||||||||||||||||||||||||||||||||||||||||||||||||||||||||||||||||||||||||||||||||||||||||||||
2004 - 2018 National Fire Incident Reporting System (NFIRS) incidents
- Incident types reported to NFIRS in Paramus, NJ
- 35236.3%Fire
- 33234.2%Hazardous Condition
- 12913.3%False Alarm
- 10210.5%Service Call
- 262.7%Good Intent Call
- 242.5%Rescue & EMS
- 20.2%Overpressure Rupture
- 20.2%Special Incident
- 10.1%Severe Weather
- Fire incident types reported to NFIRS in Paramus, NJ
- 15343.5%Structure Fires
- 10931.0%Outside Fires
- 7621.6%Mobile Property/Vehicle Fires
- 144.0%Other
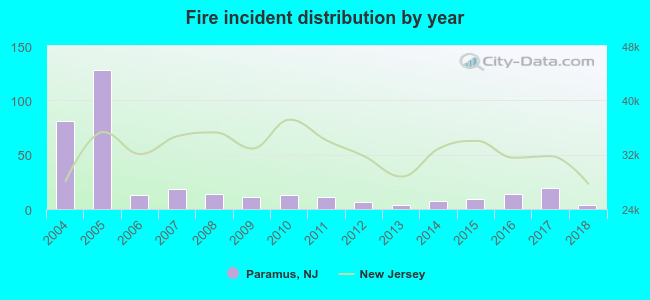 According to the data from the years 2004 - 2018 the average number of fire incidents per year is 23. The highest number of reported fire incidents - 128 took place in 2005, and the least - 4 in 2013. The data has a declining trend.
The average number of yearly fire incidents per 10k residents in Paramus, NJ compared to nearest cities:
(Note: Based on data for the last 3 years, including only cities with population 5,000 and above)
| Paramus: | 4.6 |
| Oradell: | 32.7 |
| River Edge: | 15.3 |
| Fair Lawn: | 22.2 |
| New Milford: | 8.2 |
| Rochelle Park: | 26.5 |
| Maywood: | 5.8 |
| Emerson: | 24.5 |
| Glen Rock: | 27.7 |
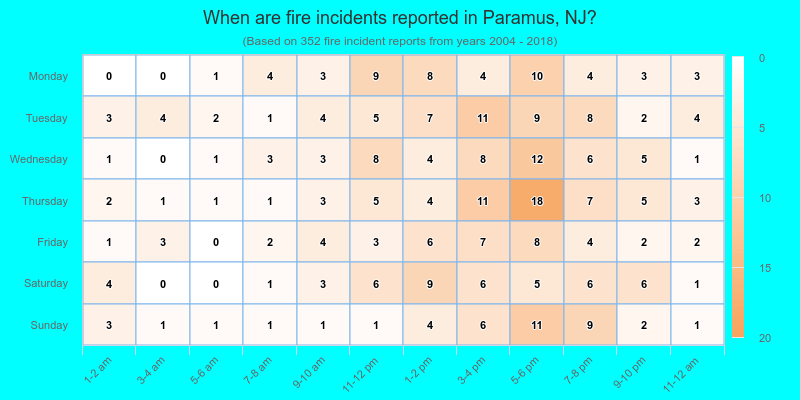
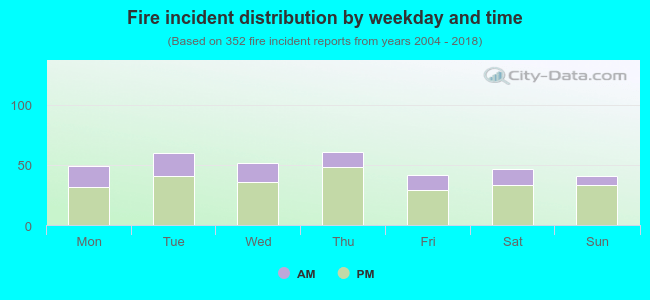 28.4% incidents where reported in the morning and 71.6% in the evening. The most fires (17.3%) took place on Thursday, and the least (11.6%) on Sunday.
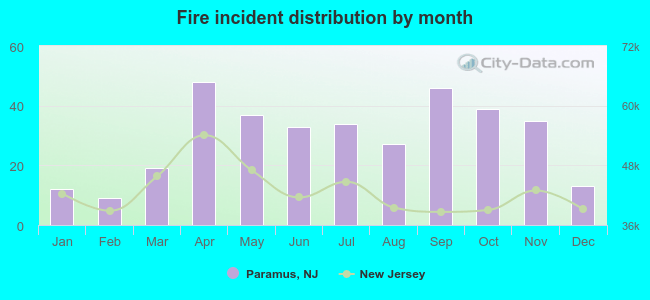 Based on the 352 fire incident reports from years 2004 - 2018 most fires (13.6%) took place during April, and the least (2.6%) in February.
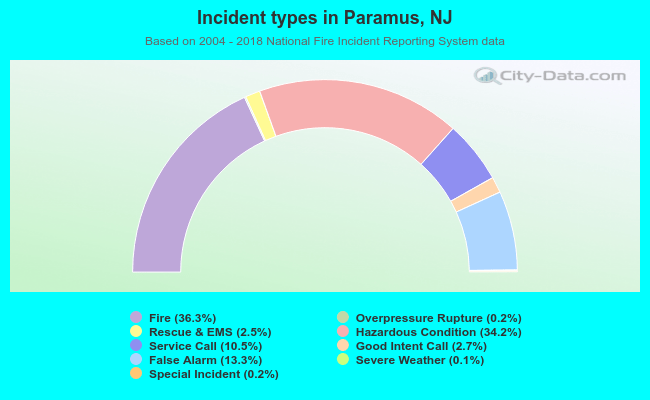 Out of all 970 cases reported during the years 2004 - 2018, the most belonged to the categories: Fire (36.3%), Hazardous Condition (34.2%), and False Alarm (13.3%).
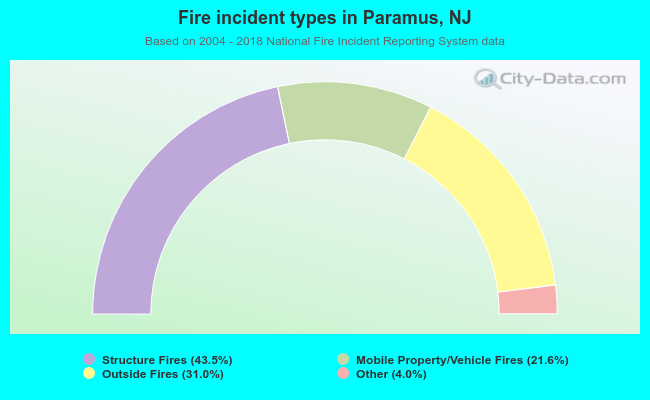 When looking into fire subcategories, the most incidents belonged to: Structure Fires (43.5%), and Outside Fires (31.0%).