Parish: Fire Incidents, New York (NY)
Where are fire incidents reported in Parish, NY
Something went wrong! Please refresh the page.
|
| |||||||||||||||||||||||||||||||||||||||||||||||||||||||||||||||||||||||||||||||||||||||||||||||||||||||||||||
2003 - 2018 National Fire Incident Reporting System (NFIRS) incidents
- Incident types reported to NFIRS in Parish, NY
- 1,24659.6%Rescue & EMS
- 24111.5%Good Intent Call
- 23211.1%Hazardous Condition
- 22410.7%Fire
- 844.0%Service Call
- 361.7%False Alarm
- 231.1%Severe Weather
- Fire incident types reported to NFIRS in Parish, NY
- 11551.3%Structure Fires
- 5524.6%Mobile Property/Vehicle Fires
- 5122.8%Outside Fires
- 31.3%Other
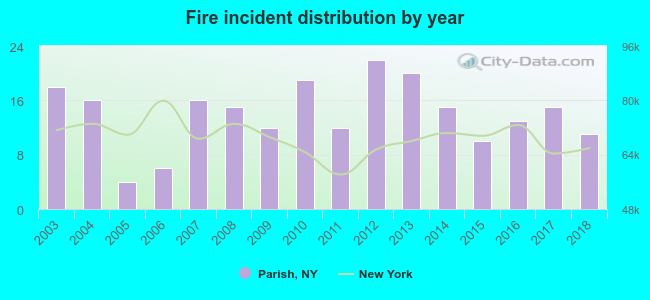 Based on the data from the years 2003 - 2018 the average number of fires per year is 14. The highest number of reported fire incidents - 22 took place in 2012, and the least - 4 in 2005. The data has a declining trend.
 34.4% incidents where reported in the morning and 65.6% in the evening. The most fires (19.2%) took place on Saturday, and the least (9.4%) on Thursday.
 Based on the 224 fire incident reports from years 2003 - 2018 most fires (15.2%) took place during September, and the least (4.0%) in August.
 Out of all 2,089 cases reported during the years 2003 - 2018, the most belonged to the categories: Rescue & EMS (59.6%), Good Intent Call (11.5%), and Hazardous Condition (11.1%).
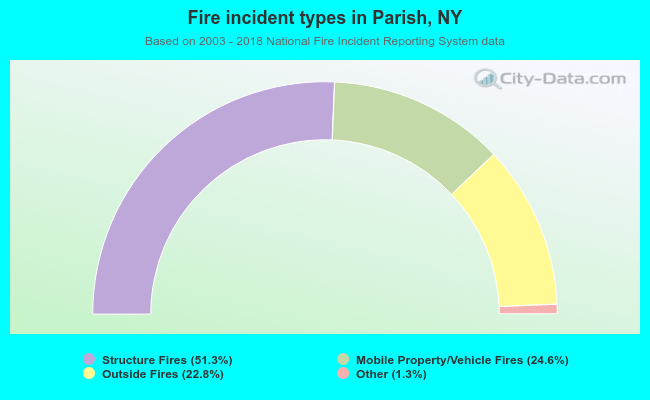 When looking into fire subcategories, the most reports belonged to: Structure Fires (51.3%), and Mobile Property/Vehicle Fires (24.6%).