| Fire incidents reported |
|---|
| Sreet name | Count |
|---|
| HWY 75 HWY | 14 | | 107 SPARROW | 10 | | HWY 64 WEST | 10 | | HWY 75 SOUTH | 10 | | PARKIN ST | 10 | | COUNTY ROAD 403 | 8 | | HIGHWAY 64 HWY | 8 | | PARKIN | 8 | | SMITHDALE | 8 | | SPARROW | 8 | | 113 LOUISE DR | 6 | | 115 WILSON ST | 6 | | 501 W SMITHDALE | 6 | | CR 451 | 6 | | CR 800 | 6 | | CR 8260 | 6 | | DAVIS ST | 6 | | HWY 42 | 6 | | HWY 64 EAST | 6 | | HWY 64 HWY | 6 | | HWY 75 NORTH | 6 | | MASSENA ROAD RD | 6 | | SMITHDALE AVE. AVE | 6 | | TYRONZA AND PARKIN | 6 | | 100 PARKIN | 4 |
| | | Fire incidents reported |
|---|
| Sreet name | Count |
|---|
| 104 LOUISE | 4 | | 108 OPALINE | 4 | | 109 LANSING | 4 | | 109 SPARROW | 4 | | 112 WEST PARKIN ST | 4 | | 115 EAST PARKIN | 4 | | 122 OPALINE | 4 | | 1261 COUNTY ROAD 403 | 4 | | 1671 SPARROW | 4 | | 208 COWILHAM | 4 | | 3002 HWY 75 N | 4 | | 312 WEST SMITHDALE | 4 | | 409 W SMITHDALE | 4 | | 621 WEST SMITHDALE | 4 | | CHURCH ST | 4 | | COUNTY ROAD 401 | 4 | | COUNTY ROAD 424 | 4 | | COUNTY ROAD 8260 | 4 | | COWILLEHAM ST | 4 | | CR 401 | 4 | | CR 403 | 4 | | CR 424/428 | 4 | | CR 425 | 4 | | CR 801 | 4 | | FRONT ST | 4 |
|
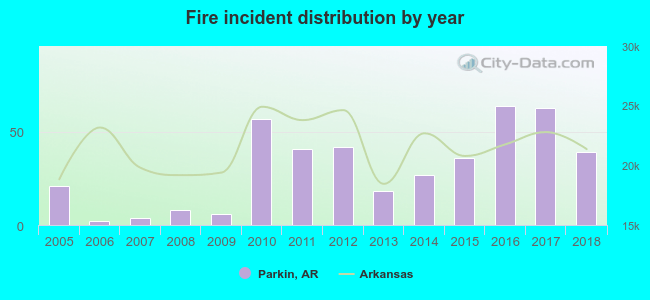 According to the data from the years 2005 - 2018 the average number of fire incidents per year is 31. The highest number of fire incidents - 64 took place in 2016, and the least - 2 in 2006. The data has a rising trend.
 31.1% incidents where reported in the morning and 68.9% in the evening. The most fires (16.9%) took place on Wednesday, and the least (11.6%) on Monday.
 Based on the 431 fire incidents from years 2005 - 2018 most fires (11.6%) took place during July, and the least (5.6%) in March.
 Out of all 564 cases reported during the years 2005 - 2018, the most belonged to the categories: Fire (76.4%), Rescue & EMS (12.2%), and Hazardous Condition (6.0%).
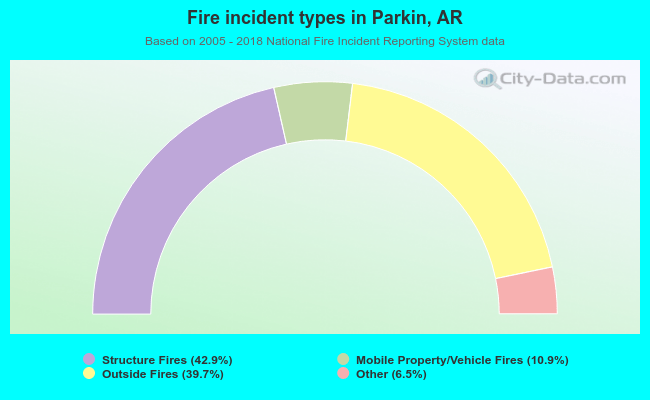 When looking into fire subcategories, the most incidents belonged to: Structure Fires (42.9%), and Outside Fires (39.7%).