Paso Robles: Fire Incidents, California (CA)
Where are fire incidents reported in Paso Robles, CA
Something went wrong! Please refresh the page.
| Fire incidents reported | |
|---|---|
| Sreet name | Count |
| SPRING ST | 144 |
| 101 HWY | 142 |
| CRESTON RD | 126 |
| NIBLICK RD | 106 |
| RIVER RD | 70 |
| RIVERSIDE AVE | 70 |
| VINE ST | 64 |
| PARK ST | 46 |
| 46 EAST HWY | 44 |
| PINE ST | 42 |
| 24TH ST | 38 |
| UNION RD | 34 |
| HIGHWAY 46 HWY | 32 |
| NICKERSON DR | 32 |
| NACIMIENTO LAKE DR | 30 |
| 13TH ST | 28 |
| ALAMO CREEK TER | 26 |
| JARDINE RD | 26 |
| NONE SELECTED | 26 |
| 12TH ST | 22 |
| LINNE RD | 22 |
| OAK HILL RD | 20 |
| OAK ST | 20 |
| RAMADA DR | 20 |
| GOLDEN HILL RD | 18 |
| BUENA VISTA DR | 16 |
| MOUNTAIN SPRINGS RD | 16 |
| NAVAJO AVE | 16 |
| NICKLAUS ST | 16 |
| OLIVE ST | 16 |
| Other | 190 |
2005 - 2018 National Fire Incident Reporting System (NFIRS) incidents
- Incident types reported to NFIRS in Paso Robles, CA
- 8,59357.5%Rescue & EMS
- 1,77711.9%Good Intent Call
- 1,51810.2%Fire
- 1,50010.0%Service Call
- 1,0096.7%Hazardous Condition
- 5013.4%False Alarm
- 520.3%Special Incident
- Fire incident types reported to NFIRS in Paso Robles, CA
- 81153.4%Outside Fires
- 43328.5%Structure Fires
- 22614.9%Mobile Property/Vehicle Fires
- 483.2%Other
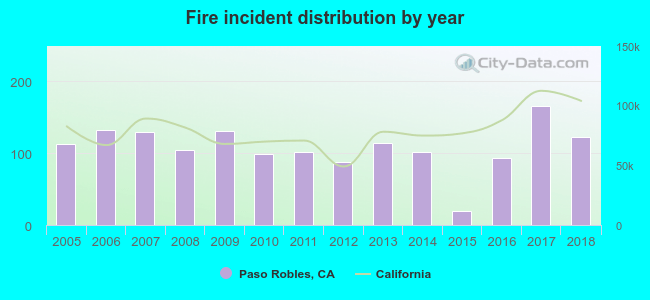 According to the data from the years 2005 - 2018 the average number of fires per year is 108. The highest number of fire incidents - 166 took place in 2017, and the least - 19 in 2015. The data has a rising trend.
The average number of yearly fire incidents per 10k residents in Paso Robles, CA compared to nearest cities:
(Note: Based on data for the last 3 years, including only cities with population 5,000 and above)
| Paso Robles: | 29.8 |
| Templeton: | 44.7 |
| Atascadero: | 15.8 |
| Morro Bay: | 3.8 |
| Los Osos: | 0.7 |
| San Luis Obispo: | 13.2 |
| Cambria: | 33.2 |
| Pismo Beach: | 9.2 |
| Grover Beach: | 0.7 |
 The median response time based on all reported fire incidents is 6 minutes. This is comparable to the state median value.
The median response time in Paso Robles, CA compared to nearest cities:
(Note: Based on data for all years, including only cities with at least 500 fire incidents)
| Paso Robles: | 6 minutes |
| San Luis Obispo: | 6 minutes |
| Coalinga: | 13 minutes |
| Avenal: | 6 minutes |
| Huron: | 9 minutes |
| Santa Maria: | 6 minutes |
| Greenfield: | 6 minutes |
| Lemoore: | 7 minutes |
| Soledad: | 7 minutes |
 28.4% incidents where reported in the morning and 71.6% in the evening. The most fires (15.3%) took place on Tuesday, and the least (13.1%) on Thursday.
 According to the 1,518 fire incidents from years 2005 - 2018 most fires (16.9%) took place during July, and the least (5.1%) in February.
 Out of all 14,953 cases reported during the years 2005 - 2018, the most belonged to the categories: Rescue & EMS (57.5%), Good Intent Call (11.9%), and Fire (10.2%).
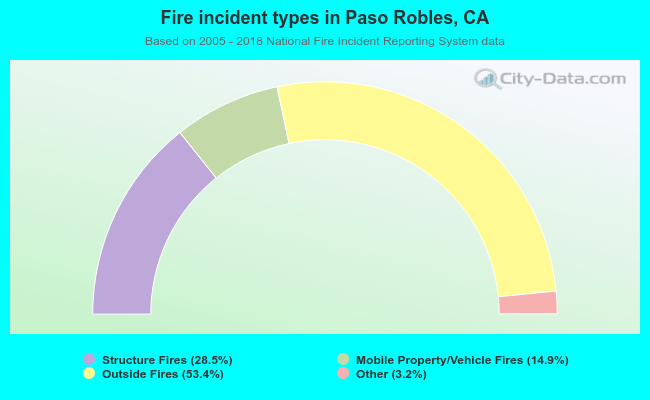 When looking into fire subcategories, the most reports belonged to: Outside Fires (53.4%), and Structure Fires (28.5%).