Pavilion: Fire Incidents, New York (NY)
Where are fire incidents reported in Pavilion, NY
Something went wrong! Please refresh the page.
|
| |||||||||||||||||||||||||||||||||||||||||||||||||||||||||||||||||||||||||||||||||||||||||||||||||||||||||||||
2002 - 2018 National Fire Incident Reporting System (NFIRS) incidents
- Incident types reported to NFIRS in Pavilion, NY
- 42439.6%Hazardous Condition
- 29927.9%Fire
- 12411.6%Rescue & EMS
- 1009.3%Service Call
- 635.9%Good Intent Call
- 504.7%False Alarm
- 40.4%Overpressure Rupture
- 40.4%Severe Weather
- 30.3%Special Incident
- Fire incident types reported to NFIRS in Pavilion, NY
- 15150.5%Structure Fires
- 8327.8%Outside Fires
- 4414.7%Mobile Property/Vehicle Fires
- 217.0%Other
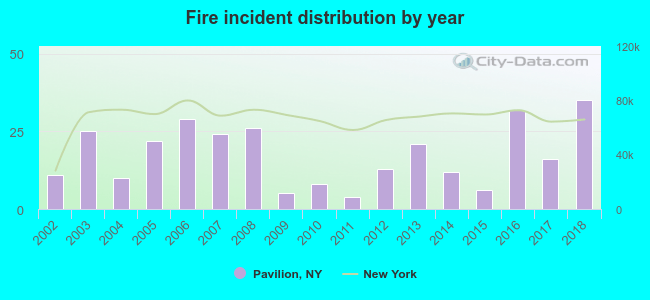 Based on the data from the years 2002 - 2018 the average number of fires per year is 18. The highest number of reported fire incidents - 35 took place in 2018, and the least - 4 in 2011. The data has a rising trend.
 25.8% incidents where reported in the morning and 74.2% in the evening. The most fires (18.1%) took place on Tuesday, and the least (11.7%) on Friday.
 Based on the 299 fire incident reports from years 2002 - 2018 most fires (14.7%) took place during May, and the least (3.3%) in July.
 Out of all 1,071 cases reported during the years 2002 - 2018, the most belonged to the categories: Hazardous Condition (39.6%), Fire (27.9%), and Rescue & EMS (11.6%).
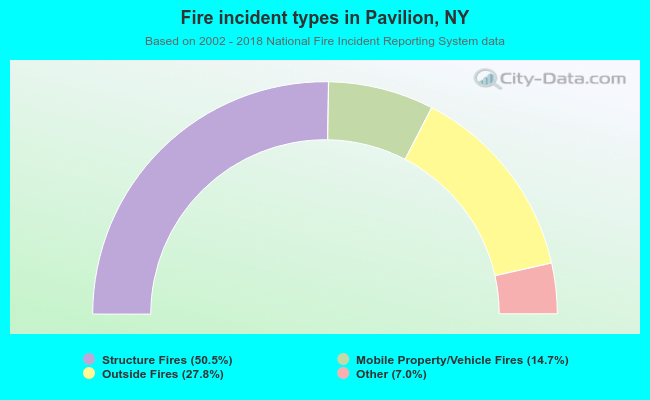 When looking into fire subcategories, the most reports belonged to: Structure Fires (50.5%), and Outside Fires (27.8%).