| Fire incidents reported |
|---|
| Sreet name | Count |
|---|
| PAW PAW RD | 22 | | ROUTE 29 | 14 | | BETHEL ROAD | 12 | | RT. 29 N | 12 | | AMELIA ST | 10 | | WINCHESTER STREET | 10 | | BETHEL RD | 8 | | MAGNOLIA ROAD | 8 | | AMELIA STRE | 6 | | CACAPON RD | 6 | | CACAPON ROAD | 6 | | CRITTON OWL HOLLOW ROAD | 6 | | JACKSON ST | 6 | | LEE STRE | 6 | | LEE STREET | 6 | | MAGNOLIA RD | 6 | | PAW PAW ROAD | 6 | | WINCHESTER ST | 6 | | 60 PIRATE CIRCLE | 4 | | AMELIA STREET | 4 | | BOWERS LANE | 4 | | CACAPON ROAD | 4 | | CHURCH ST | 4 | | CRITTON HOLLOW ROAD | 4 | | DR RANDOLPH SPENCER LANE | 4 |
| | | Fire incidents reported |
|---|
| Sreet name | Count |
|---|
| ERNIE LN | 4 | | FRANK HAINES ROAD | 4 | | HENRY W MILLER BLVD | 4 | | LEE ST | 4 | | OKONOKO ROAD | 4 | | ORCHARD LANE | 4 | | ORCHARD LN | 4 | | OWL HOLLOW RD. | 4 | | PAW PAW AREA | 4 | | RT 29 | 4 | | RT. 1 BOX 93 | 4 | | 10 LOUIE LANE | 2 | | 1069 POWERS HOLLOW LANE | 2 | | 11 ORCHARD LANE | 2 | | 11 ORCHARD LN | 2 | | 111 DOGWOOD TRAIL | 2 | | 139 JACKSON STREET | 2 | | 15 TURNERS CROSSING LANE | 2 | | 160 LOCUST CT | 2 | | 1600 BLK MAGNOLIA ROAD | 2 | | 1825 GRAND PAPS LANE | 2 | | 200 WINCHESTER STREET | 2 | | 2000 BLOCK OF PAW PAW ROAD | 2 | | 215 HENRY MILLER BLVD. | 2 | | |
|
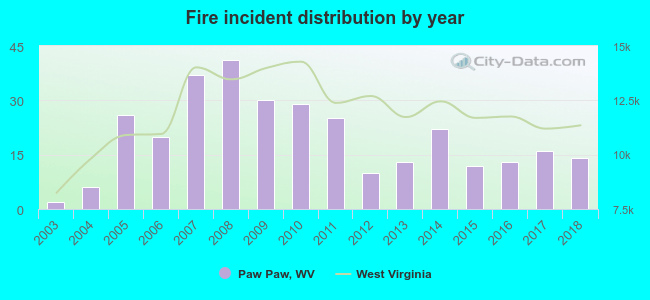 According to the data from the years 2003 - 2018 the average number of fires per year is 20. The highest number of fire incidents - 41 took place in 2008, and the least - 2 in 2003. The data has a growing trend.
 26.3% incidents where reported in the morning and 73.7% in the evening. The most fires (16.8%) took place on Monday, and the least (11.4%) on Friday.
 Based on the 316 fire incidents from years 2003 - 2018 most fires (18.4%) took place during April, and the least (2.5%) in October.
 Out of all 786 cases reported during the years 2003 - 2018, the most belonged to the categories: Fire (40.2%), Rescue & EMS (30.7%), and Good Intent Call (13.5%).
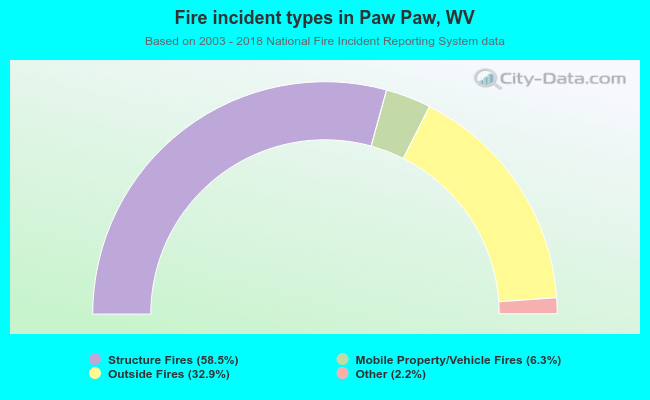 When looking into fire subcategories, the most incidents belonged to: Structure Fires (58.5%), and Outside Fires (32.9%).