Pawcatuck: Fire Incidents, Connecticut (CT)
Where are fire incidents reported in Pawcatuck, CT
Something went wrong! Please refresh the page.
|
| |||||||||||||||||||||||||||||||||||||||||||||||||||||||||||||||||||||||||||||||||||||||||||||||||||||||||||||
2002 - 2018 National Fire Incident Reporting System (NFIRS) incidents
- Incident types reported to NFIRS in Pawcatuck, CT
- 1,42861.4%Hazardous Condition
- 29312.6%Fire
- 2219.5%False Alarm
- 2169.3%Service Call
- 1396.0%Good Intent Call
- 210.9%Rescue & EMS
- 60.3%Severe Weather
- Fire incident types reported to NFIRS in Pawcatuck, CT
- 12241.6%Structure Fires
- 9632.8%Outside Fires
- 5318.1%Mobile Property/Vehicle Fires
- 227.5%Other
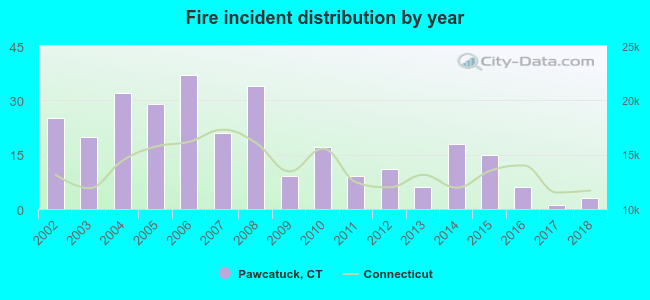 Based on the data from the years 2002 - 2018 the average number of fires per year is 17. The highest number of fires - 37 took place in 2006, and the least - 1 in 2017. The data has a dropping trend.
The average number of yearly fire incidents per 10k residents in Pawcatuck, CT compared to nearest cities:
(Note: Based on data for the last 3 years, including only cities with population 5,000 and above)
| Pawcatuck: | 5.9 |
| North Stonington: | 49.1 |
| Ledyard: | 22.6 |
| Groton: | 75.6 |
| New London: | 56.0 |
| Waterford: | 24.3 |
| Griswold: | 76.7 |
| Norwich: | 38.9 |
| Montville: | 19.2 |

 30.4% incidents where reported in the morning and 69.6% in the evening. The most fires (19.1%) took place on Saturday, and the least (11.3%) on Sunday.
 Based on the 293 fire incidents from years 2002 - 2018 most fires (14.0%) took place during March, and the least (3.8%) in August.
 Out of all 2,326 cases reported during the years 2002 - 2018, the most belonged to the categories: Hazardous Condition (61.4%), Fire (12.6%), and False Alarm (9.5%).
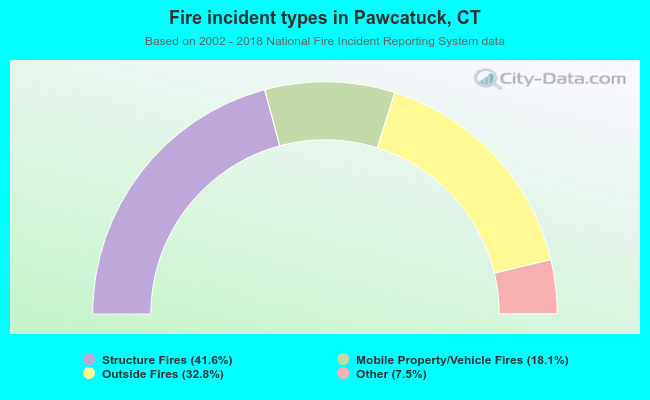 When looking into fire subcategories, the most reports belonged to: Structure Fires (41.6%), and Outside Fires (32.8%).