| Fire incidents reported |
|---|
| Sreet name | Count |
|---|
| HIGHWAY 18 | 6 | | 44451 E 51 RD | 4 | | 45451 DEER CREEK TRAIL | 4 | | 1 MILE EAST OF PAWNEE | 2 | | 1 MILE SOUTH OF 64 ON HWY 108 | 2 | | 1001 AGENCY ROAD | 2 | | 111 EAGLE CHIEF DRIVE | 2 | | 111 EAGLECHIEF DR | 2 | | 11TH STREET | 2 | | 1207 7TH | 2 | | 1209 7TH | 2 | | 127 MYHD | 2 | | 1301 6TH | 2 | | 1301 9TH PLACE | 2 | | 1401 4TH | 2 | | 1410 4TH | 2 | | 1506 8TH | 2 | | 2 MI N OF SH 18 | 2 | | 202 BECK DRIVE | 2 | | 219 PARK LANE | 2 | | 2629 S 34200 RD | 2 | | 300 ILLINOIS | 2 | | 313 KANSAS | 2 | | 314 DENVER | 2 | | 320 NASH | 2 |
| | | Fire incidents reported |
|---|
| Sreet name | Count |
|---|
| 34200 RD | 2 | | 34451 E51RD | 2 | | 344551 E 4200 RD | 2 | | 346250 E 4500RD | 2 | | 346451 E. 4500 RD | 2 | | 34900 S RD | 2 | | 349561 E. 4900 RD | 2 | | 349752 E 4550 RD | 2 | | 350101 E 4550 RD | 2 | | 353 ROAD | 2 | | 35800 RD | 2 | | 38500 S 34500 RD | 2 | | 39001 S. 34500 RD | 2 | | 410 DENVER | 2 | | 41010 S 34800 RD | 2 | | 41151 S 348 RD | 2 | | 42473 S. 349 RD | 2 | | 44200 E 38 RD | 2 | | 44800 S 347 RD | 2 | | 45426 E 48RD | 2 | | 4550 S 346 RD | 2 | | 45500 E. 47 RD | 2 | | 46050 S 336 RD | 2 | | 46101 E46 RD | 2 | | |
|
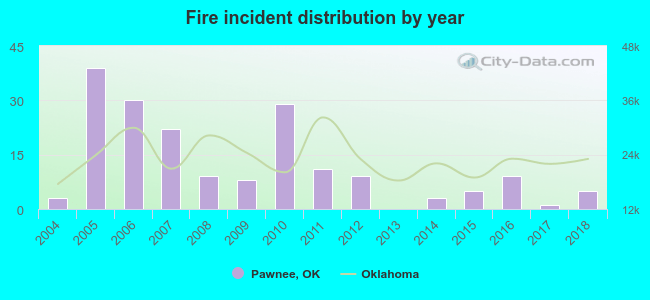 Based on the data from the years 2004 - 2018 the average number of fire incidents per year is 12. The highest number of fires - 39 took place in 2005, and the least - 0 in 2013. The data has a growing trend.
 Based on the data from the years 2004 - 2018 the average number of fire-related casualties per year is 0. The highest number of reported injuries - 3 took place in 2007, and the lowest - 0 in 2004. The data has a constant trend.
 26.8% incidents where reported in the morning and 73.2% in the evening. The most fires (19.7%) took place on Wednesday, and the least (9.3%) on Saturday.
 Based on the 183 reports from years 2004 - 2018 most fires (15.3%) took place during January, and the least (2.2%) in May.
 Out of all 212 cases reported during the years 2004 - 2018, the most belonged to the categories: Fire (86.3%), Service Call (8.0%), and Rescue & EMS (3.3%).
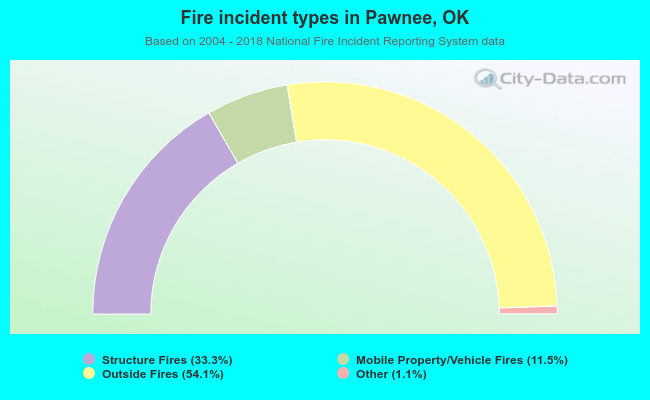 When looking into fire subcategories, the most reports belonged to: Outside Fires (54.1%), and Structure Fires (33.3%).