Peabody: Fire Incidents, Massachusetts (MA)
Where are fire incidents reported in Peabody, MA
Something went wrong! Please refresh the page.
| Fire incidents reported | |
|---|---|
| Sreet name | Count |
| NEWBURY ST | 222 |
| ANDOVER ST | 190 |
| LOWELL ST | 142 |
| LOWELL ST | 110 |
| NEWBURY ST | 106 |
| CENTRAL ST | 90 |
| WASHINGTON ST | 86 |
| MAIN ST | 78 |
| ANDOVER ST | 74 |
| LYNN ST | 66 |
| BROOKSBY VILLAGE DR | 64 |
| ROUTE 128 | 64 |
| LYNNFIELD ST | 60 |
| CENTENNIAL DR | 58 |
| NEWBURY STREET | 50 |
| ANDOVER STREET | 46 |
| FOSTER ST | 44 |
| MAIN ST | 44 |
| WALNUT ST | 44 |
| CENTRAL ST | 42 |
| JOHNSON ST | 42 |
| PULASKI ST | 42 |
| PEABODY SQ | 38 |
| ROUTE 95 | 38 |
| CENTRAL STREET | 36 |
| LAKE ST | 36 |
| SUNSET DR | 36 |
| TREMONT ST | 32 |
| CRANEBROOK WAY | 30 |
| FOREST ST | 30 |
| Other | 989 |
2002 - 2018 National Fire Incident Reporting System (NFIRS) incidents
- Incident types reported to NFIRS in Peabody, MA
- 21,20452.4%Rescue & EMS
- 5,72714.2%False Alarm
- 5,34813.2%Hazardous Condition
- 3,0297.5%Fire
- 3,0257.5%Good Intent Call
- 2,0065.0%Service Call
- 470.1%Special Incident
- Fire incident types reported to NFIRS in Peabody, MA
- 1,35344.7%Structure Fires
- 1,15938.3%Outside Fires
- 32510.7%Mobile Property/Vehicle Fires
- 1926.3%Other
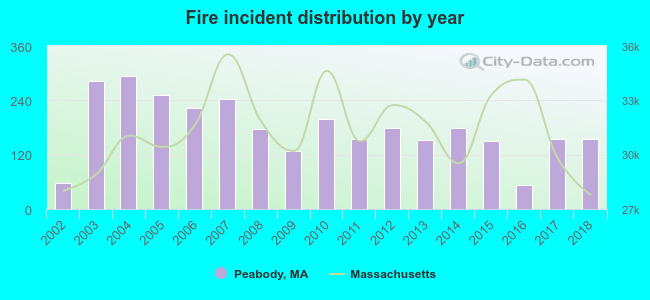 According to the data from the years 2002 - 2018 the average number of fires per year is 178. The highest number of reported fire incidents - 293 took place in 2004, and the least - 53 in 2016. The data has a growing trend.
The average number of yearly fire incidents per 10k residents in Peabody, MA compared to nearest cities:
(Note: Based on data for the last 3 years, including only cities with population 5,000 and above)
| Peabody: | 23.0 |
| Danvers: | 40.5 |
| Salem: | 37.4 |
| Lynnfield: | 81.9 |
| Lynn: | 45.3 |
| Beverly: | 25.5 |
| Swampscott: | 28.8 |
| Middleton: | 34.9 |
| Saugus: | 48.2 |
 The median response time based on all reported fire incidents is 5 minutes. This is higher than the state median value.
The median response time in Peabody, MA compared to nearest cities:
(Note: Based on data for all years, including only cities with at least 500 fire incidents)
| Peabody: | 5 minutes |
| Danvers: | 5 minutes |
| Salem: | 3 minutes |
| Lynnfield: | 5 minutes |
| Lynn: | 4 minutes |
| Beverly: | 4 minutes |
| Swampscott: | 4 minutes |
| Middleton: | 4 minutes |
| Saugus: | 5 minutes |
 According to the reports from the years 2002 - 2018 the average number of fire-related yearly casualties is 1. The highest number of reported injuries - 5 took place in 2004, and the lowest - 0 in 2002. The data has a constant trend.
The average number of injuries per 1,000 fires is 5. This indicator was the highest - 17 in 2004, and the lowest 0 in 2002. The trend for injuries per 1,000 incidents is increasing. Compared to the state value the number of injuries per 1,000 incidents is lower.
According to the reports from the years 2002 - 2018 the average number of fire-related yearly casualties is 1. The highest number of reported injuries - 5 took place in 2004, and the lowest - 0 in 2002. The data has a constant trend.
The average number of injuries per 1,000 fires is 5. This indicator was the highest - 17 in 2004, and the lowest 0 in 2002. The trend for injuries per 1,000 incidents is increasing. Compared to the state value the number of injuries per 1,000 incidents is lower.
 29.1% incidents where reported in the morning and 70.9% in the evening. The most fires (15.3%) took place on Sunday, and the least (12.7%) on Thursday.
 According to the 3,029 fires from years 2002 - 2018 most fires (11.7%) took place during April, and the least (6.1%) in February.
 Out of all 40,436 cases reported during the years 2002 - 2018, the most belonged to the categories: Rescue & EMS (52.4%), False Alarm (14.2%), and Hazardous Condition (13.2%).
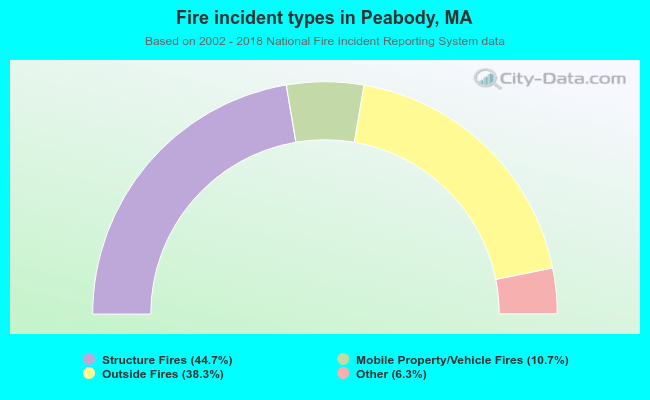 When looking into fire subcategories, the most reports belonged to: Structure Fires (44.7%), and Outside Fires (38.3%).