Penn Yan: Fire Incidents, New York (NY)
Where are fire incidents reported in Penn Yan, NY
Something went wrong! Please refresh the page.
|
| |||||||||||||||||||||||||||||||||||||||||||||||||||||||||||||||||||||||||||||||||||||||||||||||||||||||||||||
2003 - 2018 National Fire Incident Reporting System (NFIRS) incidents
- Incident types reported to NFIRS in Penn Yan, NY
- 63027.2%Rescue & EMS
- 54123.4%Hazardous Condition
- 37216.1%False Alarm
- 28612.4%Fire
- 28512.3%Service Call
- 1767.6%Good Intent Call
- 140.6%Special Incident
- 70.3%Severe Weather
- 40.2%Overpressure Rupture
- Fire incident types reported to NFIRS in Penn Yan, NY
- 14550.7%Structure Fires
- 9332.5%Outside Fires
- 3211.2%Mobile Property/Vehicle Fires
- 165.6%Other
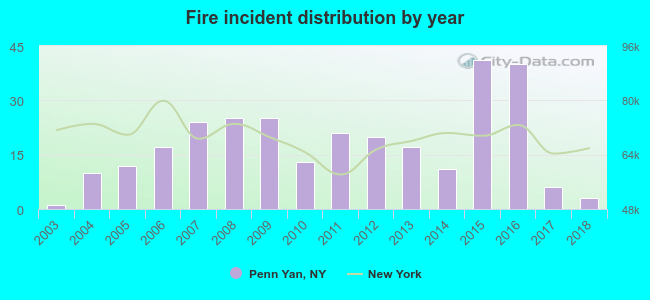 According to the data from the years 2003 - 2018 the average number of fires per year is 18. The highest number of reported fires - 41 took place in 2015, and the least - 1 in 2003. The data has a growing trend.
The average number of yearly fire incidents per 10k residents in Penn Yan, NY compared to nearest cities:
(Note: Based on data for the last 3 years, including only cities with population 5,000 and above)
| Penn Yan: | 32.3 |
| Geneva: | 50.2 |
| Canandaigua: | 116.0 |
| Waterloo: | 97.7 |
| Seneca Falls: | 77.4 |
| Farmington: | 38.3 |
| Bath: | 100.8 |
| Newark: | 26.2 |
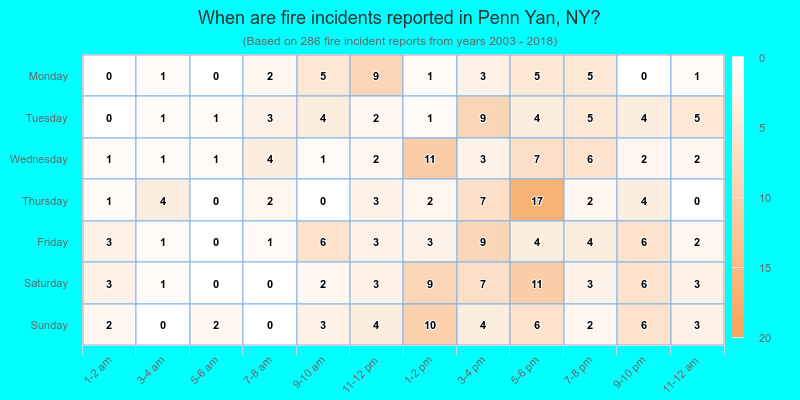
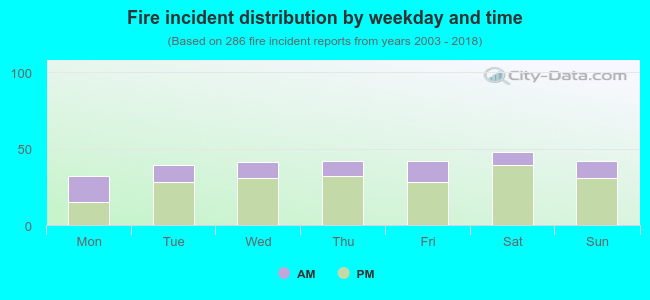 28.7% incidents where reported in the morning and 71.3% in the evening. The most fires (16.8%) took place on Saturday, and the least (11.2%) on Monday.
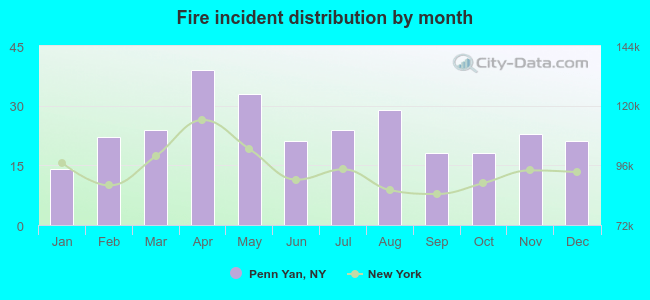 According to the 286 incident reports from years 2003 - 2018 most fires (13.6%) took place during April, and the least (4.9%) in January.
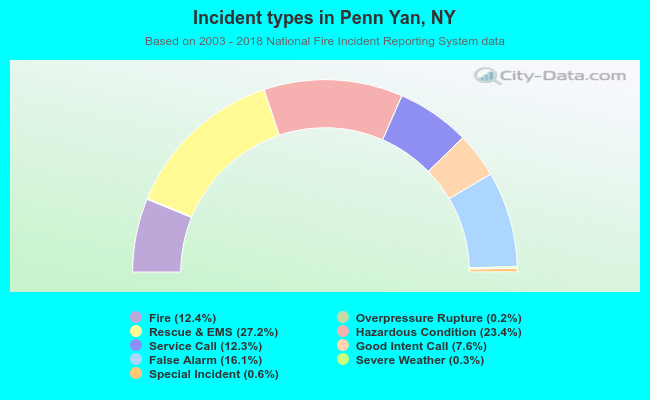 Out of all 2,315 cases reported during the years 2003 - 2018, the most belonged to the categories: Rescue & EMS (27.2%), Hazardous Condition (23.4%), and False Alarm (16.1%).
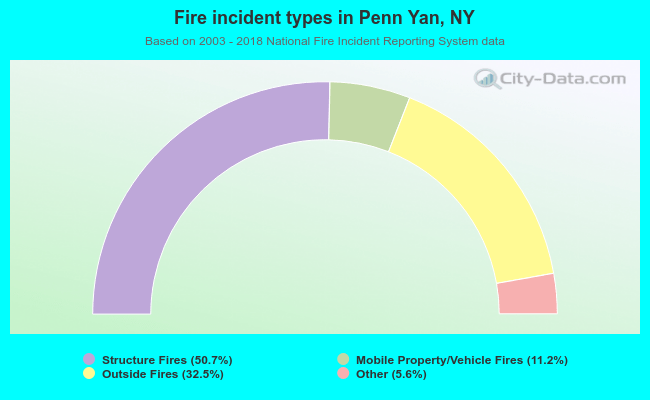 When looking into fire subcategories, the most incidents belonged to: Structure Fires (50.7%), and Outside Fires (32.5%).