Perrinton: Fire Incidents, Michigan (MI)
Where are fire incidents reported in Perrinton, MI
Something went wrong! Please refresh the page.
|
| |||||||||||||||||||||||||||||||||||||||||||||||||||||||||||||||||||||||||||||||||||||||||||||||||||||||||||||
2002 - 2018 National Fire Incident Reporting System (NFIRS) incidents
- Incident types reported to NFIRS in Perrinton, MI
- 11740.1%Rescue & EMS
- 11138.0%Fire
- 3612.3%Hazardous Condition
- 144.8%Good Intent Call
- 82.7%Service Call
- 41.4%False Alarm
- 20.7%Special Incident
- Fire incident types reported to NFIRS in Perrinton, MI
- 6558.6%Structure Fires
- 3632.4%Outside Fires
- 87.2%Mobile Property/Vehicle Fires
- 21.8%Other
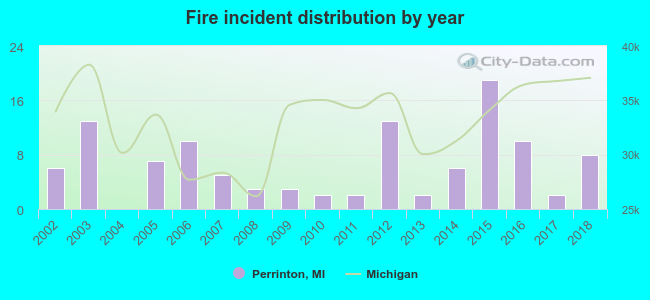 According to the data from the years 2002 - 2018 the average number of fires per year is 7. The highest number of reported fire incidents - 19 took place in 2015, and the least - 0 in 2004. The data has an increasing trend.
 28.8% incidents where reported in the morning and 71.2% in the evening. The most fires (20.7%) took place on Friday, and the least (8.1%) on Wednesday.
 According to the 111 incident reports from years 2002 - 2018 most fires (16.2%) took place during April, and the least (2.7%) in September.
 Out of all 292 cases reported during the years 2002 - 2018, the most belonged to the categories: Overpressure Rupture (40.1%), Fire (38.0%), and Rescue & EMS (12.3%).
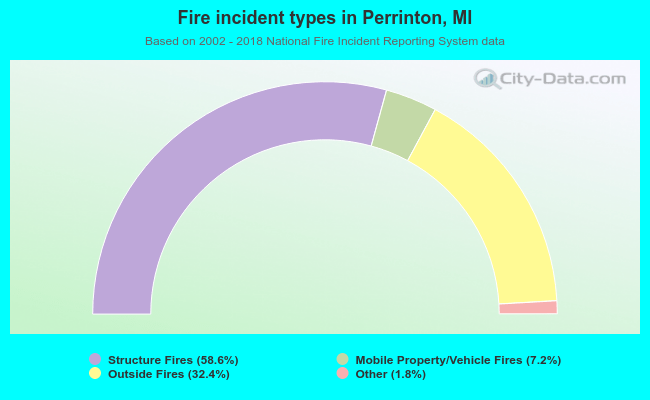 When looking into fire subcategories, the most incidents belonged to: Structure Fires (58.6%), and Outside Fires (32.4%).