| Fire incidents reported |
|---|
| Sreet name | Count |
|---|
| HWY 107 | 16 | | HWY J | 16 | | HWY 154 | 14 | | TRUMAN LANE | 8 | | HWY 19 | 6 | | HWY BB | 6 | | HWY D | 6 | | HWY Y | 6 | | 23181 JOANNA DRIVE | 4 | | 31826 MEXICO RD | 4 | | 40067 MONROE RD. 606 | 4 | | 40478 LICK CREEK LANE | 4 | | ADAMS TRAIL | 4 | | JOANNA DRIVE | 4 | | MAIN ST | 4 | | MEXICO RD. | 4 | | MONROE RD. 581 | 4 | | 105 WATER | 2 | | 12242 RT. O | 2 | | 12420 RT O | 2 | | 154 SOUTH FORK BOAT RAMP | 2 | | 17724 MAGNOLIA RD | 2 | | 181 DFONI RD | 2 | | 18904 MR 581 | 2 | | 208 N. PALMYRA ST. | 2 |
| | | Fire incidents reported |
|---|
| Sreet name | Count |
|---|
| 21312 HWY J | 2 | | 21872 JOANNA DR | 2 | | 21982 JOANNA DRIVE | 2 | | 22244 JOANNA DRIVE | 2 | | 22422 LICK CREEK ESTATES | 2 | | 22665 JOANNA DRIVE | 2 | | 22764 JOANNA DRIVE | 2 | | 22845 LICK CREEK ESTATES PLACE | 2 | | 23172 JOANNA | 2 | | 23700 PIGEON ROOST | 2 | | 23768 HWY J | 2 | | 24433 DOUBLE B RANCH | 2 | | 25764 HOPKINS LANE | 2 | | 27292 SHARPS PLACE | 2 | | 27826 FLORIDA RD LGTS | 2 | | 28204 FLORIDA RD | 2 | | 28474 FLORIDA RD | 2 | | 28936 DAMASCUS LANE | 2 | | 29951 MEXICO RD | 2 | | 30329 MEXICO ROAD | 2 | | 304 E MAYHALL STREET | 2 | | 309 PALMYRA ST. | 2 | | 311 PALMYRA ST. | 2 | | 31826 MEXICO ROAD | 2 | | 33388 MR 670 | 2 |
|
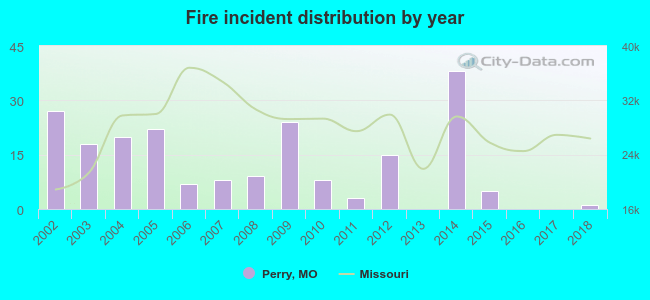 According to the data from the years 2002 - 2018 the average number of fires per year is 12. The highest number of reported fires - 38 took place in 2014, and the least - 0 in 2013. The data has a decreasing trend.
 38.5% incidents where reported in the morning and 61.5% in the evening. The most fires (20.5%) took place on Saturday, and the least (11.7%) on Tuesday.
 According to the 205 fire incidents from years 2002 - 2018 most fires (22.9%) took place during March, and the least (2.4%) in August.
 Out of all 249 cases reported during the years 2002 - 2018, the most belonged to the categories: Fire (82.3%), Overpressure Rupture (6.8%), and Rescue & EMS (4.8%).
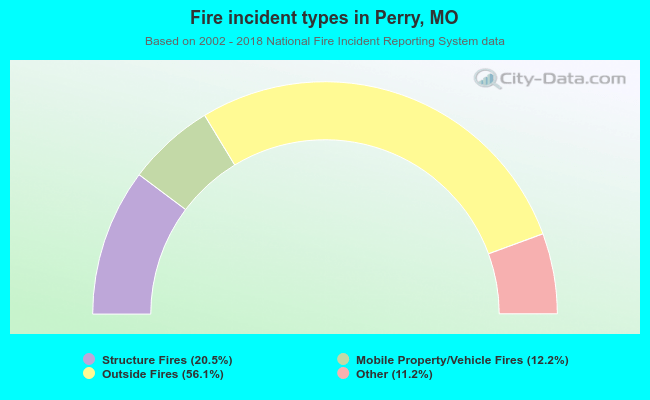 When looking into fire subcategories, the most incidents belonged to: Outside Fires (56.1%), and Structure Fires (20.5%).