Phoenix: Fire Incidents, Oregon (OR)
Where are fire incidents reported in Phoenix, OR
Something went wrong! Please refresh the page.
|
| |||||||||||||||||||||||||||||||||||||||||||||||||||||||||||||||||||||||||||||||||||||||||||||||||||||||||||||
2002 - 2017 National Fire Incident Reporting System (NFIRS) incidents
- Incident types reported to NFIRS in Phoenix, OR
- 1,67955.1%Rescue & EMS
- 45815.0%Service Call
- 36311.9%Fire
- 35711.7%Good Intent Call
- 983.2%Hazardous Condition
- 812.7%False Alarm
- 70.2%Overpressure Rupture
- Fire incident types reported to NFIRS in Phoenix, OR
- 16846.3%Structure Fires
- 12835.3%Outside Fires
- 4813.2%Mobile Property/Vehicle Fires
- 195.2%Other
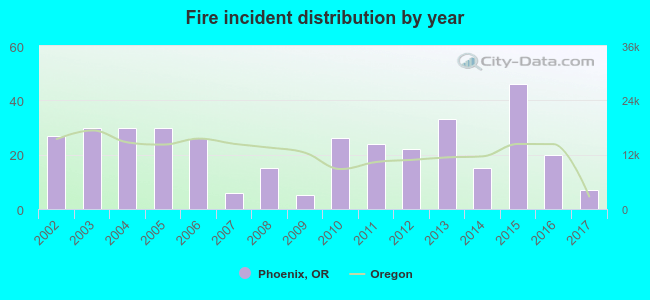 According to the data from the years 2002 - 2017 the average number of fires per year is 23. The highest number of fire incidents - 46 took place in 2015, and the least - 5 in 2009. The data has a decreasing trend.
 30.6% incidents where reported in the morning and 69.4% in the evening. The most fires (17.6%) took place on Sunday, and the least (9.4%) on Friday.
 Based on the 363 fire incident reports from years 2002 - 2017 most fires (16.3%) took place during July, and the least (3.9%) in November.
 Out of all 3,045 cases reported during the years 2002 - 2017, the most belonged to the categories: Rescue & EMS (55.1%), Service Call (15.0%), and Fire (11.9%).
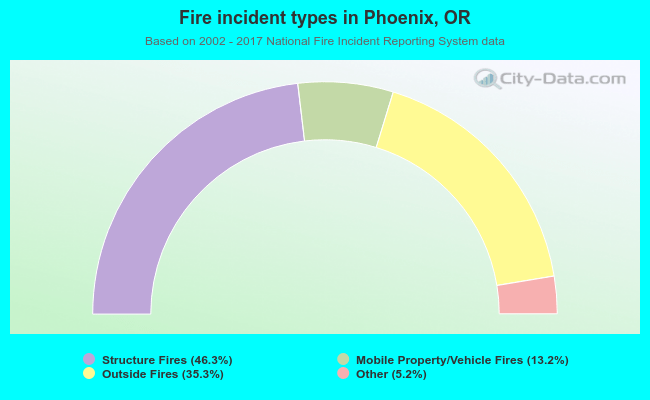 When looking into fire subcategories, the most reports belonged to: Structure Fires (46.3%), and Outside Fires (35.3%).