Piedmont: Fire Incidents, Oklahoma (OK)
Where are fire incidents reported in Piedmont, OK
Something went wrong! Please refresh the page.
|
| |||||||||||||||||||||||||||||||||||||||||||||||||||||||||||||||||||||||||||||||||||||||||||||||||||||||||||||
2004 - 2018 National Fire Incident Reporting System (NFIRS) incidents
- Incident types reported to NFIRS in Piedmont, OK
- 1,14936.0%Rescue & EMS
- 81125.4%Service Call
- 46314.5%Fire
- 3079.6%Hazardous Condition
- 2838.9%Good Intent Call
- 1625.1%False Alarm
- 90.3%Severe Weather
- Fire incident types reported to NFIRS in Piedmont, OK
- 27860.0%Outside Fires
- 14531.3%Structure Fires
- 265.6%Mobile Property/Vehicle Fires
- 143.0%Other
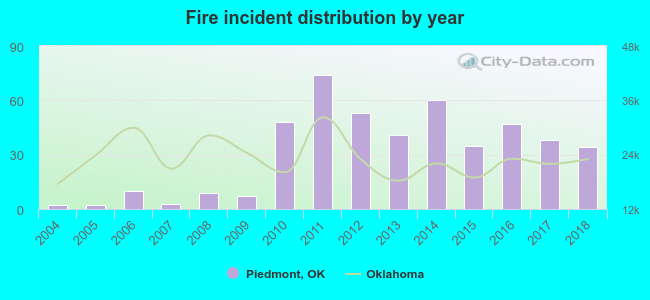 According to the data from the years 2004 - 2018 the average number of fire incidents per year is 31. The highest number of reported fire incidents - 74 took place in 2011, and the least - 2 in 2004. The data has an increasing trend.
The average number of yearly fire incidents per 10k residents in Piedmont, OK compared to nearest cities:
(Note: Based on data for the last 3 years, including only cities with population 5,000 and above)
| Piedmont: | 58.9 |
| Yukon: | 78.8 |
| Warr Acres: | 38.4 |
| The Village: | 24.7 |
| Bethany: | 32.2 |
| El Reno: | 59.7 |
| Edmond: | 49.5 |
| Oklahoma City: | 37.3 |
| Mustang: | 48.0 |
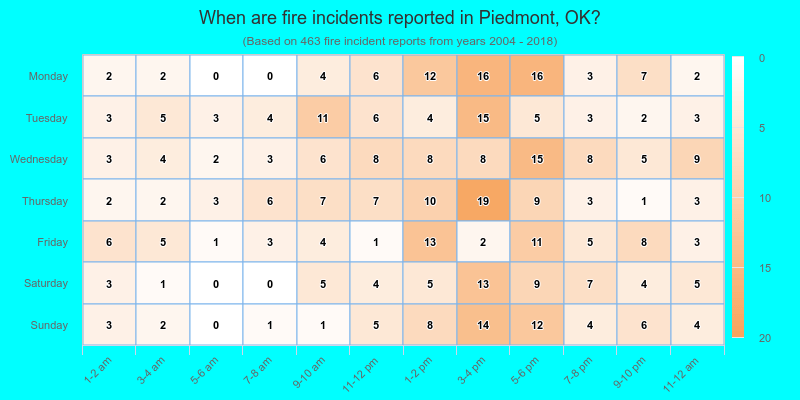
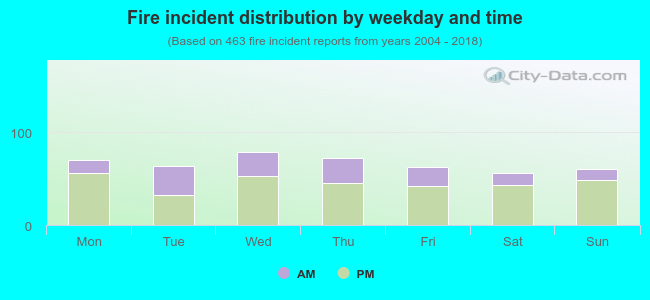 31.1% incidents where reported in the morning and 68.9% in the evening. The most fires (17.1%) took place on Wednesday, and the least (12.1%) on Saturday.
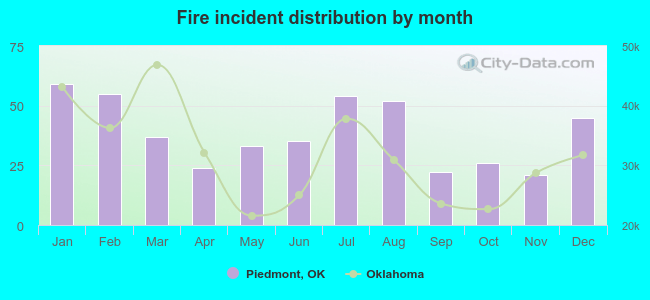 Based on the 463 fire incident reports from years 2004 - 2018 most fires (12.7%) took place during January, and the least (4.5%) in November.
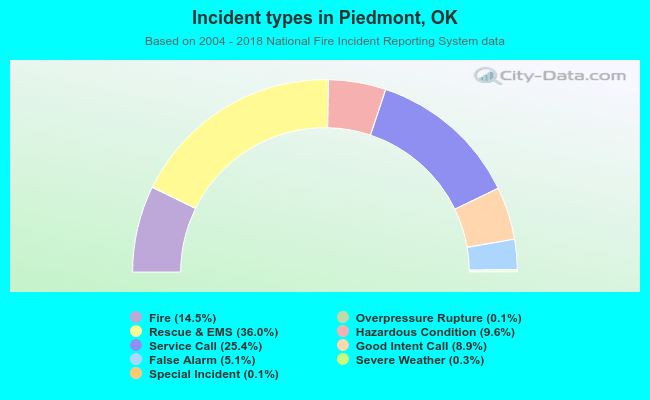 Out of all 3,189 cases reported during the years 2004 - 2018, the most belonged to the categories: Rescue & EMS (36.0%), Service Call (25.4%), and Fire (14.5%).
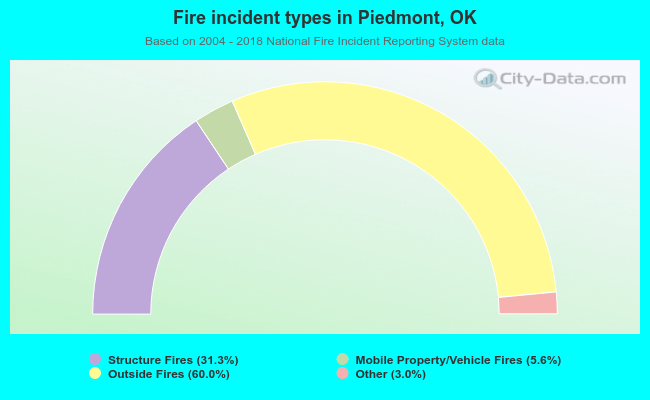 When looking into fire subcategories, the most incidents belonged to: Outside Fires (60.0%), and Structure Fires (31.3%).