| Fire incidents reported |
|---|
| Sreet name | Count |
|---|
| JESSE JAMES RD | 10 | | BIG SUGAR RD | 8 | | ELK RIVER RD | 8 | | 250 MALCOM LN | 6 | | 90 HWY | 6 | | BIG SUGAR CREEK RD | 6 | | FALCON LN | 6 | | ROUTE K | 6 | | 1523 LITTLE MISSOURI RD | 4 | | 261 FARNUM LN | 4 | | 90/CO 40 HWY | 4 | | GOODIN HOLLOW RD | 4 | | H HIGHWAY HWY | 4 | | HWY 71 | 4 | | LAKEVIEW DR | 4 | | MEDOWLARK LN | 4 | | PACKET HOLLOW RD | 4 | | PLAINVIEW RD | 4 | | SQUIRREL LN | 4 | | WOODHAVEN LN | 4 | | ALY | 2 | | 102 RETI ROAD | 2 | | 1054 GIBBS LN | 2 | | 10641 E STATE HWY 90 | 2 | | 1130 RAINS ROAD | 2 |
| | | Fire incidents reported |
|---|
| Sreet name | Count |
|---|
| 1137 DEER TRAIL DR | 2 | | 11385 ROUTE E | 2 | | 11941 HIGHWAY E | 2 | | 12744 ROUTE E | 2 | | 1277 JESSE JAMES RD | 2 | | 129 AMBER LANE | 2 | | 13034 HIGHWAY E | 2 | | 13308 HWY E | 2 | | 13308 ROUTE E | 2 | | 134 SWAN LN | 2 | | 1362 ATKINS RD | 2 | | 1383 GOFF RIDGE RD | 2 | | 156 CLEVELAND LN | 2 | | 1644 LAUGHLIN RIDGE RD | 2 | | 1675 TICK RIDGE | 2 | | 1695 W. OUTER RD. | 2 | | 1734 COOPERS RD | 2 | | 1737 BEAR HOLLOW RD | 2 | | 1773 BEAR HOLLOW ROAD | 2 | | 1783 SUGAR VALLEY CIRCLE | 2 | | 1848 LAUGHLIN RIDGE RD | 2 | | 190 PEA RIDGE RD | 2 | | 2332 PACKET HOLLOW RD | 2 | | 238 GOFF RIDGE ROAD | 2 | | 263 HERD RD | 2 |
|
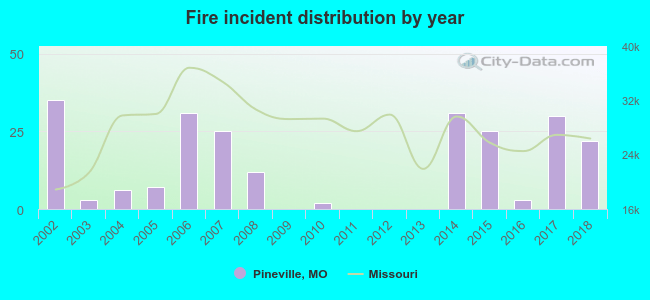 Based on the data from the years 2002 - 2018 the average number of fires per year is 14. The highest number of reported fires - 35 took place in 2002, and the least - 0 in 2009. The data has a declining trend.
 32.3% incidents where reported in the morning and 67.7% in the evening. The most fires (17.2%) took place on Saturday, and the least (10.8%) on Friday.
 Based on the 232 fire incident reports from years 2002 - 2018 most fires (16.4%) took place during January, and the least (3.0%) in August.
 Out of all 678 cases reported during the years 2002 - 2018, the most belonged to the categories: Rescue & EMS (45.9%), Fire (34.2%), and Service Call (9.3%).
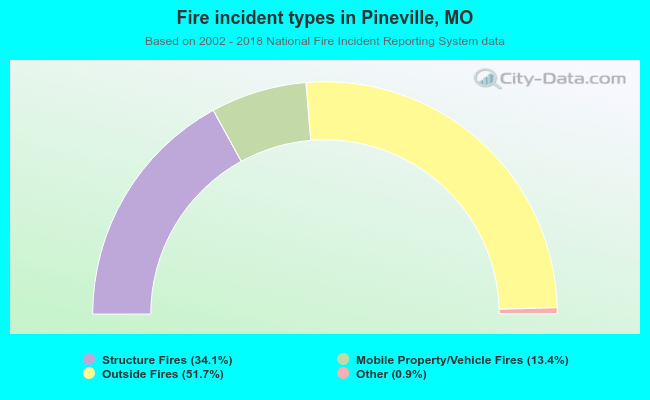 When looking into fire subcategories, the most incidents belonged to: Outside Fires (51.7%), and Structure Fires (34.1%).