| Fire incidents reported |
|---|
| Sreet name | Count |
|---|
| WEST AVE | 34 | | ELLIOTT RD | 24 | | HWY 261 | 24 | | PANOLA RD | 22 | | PINEWOOD RD | 16 | | REYNOLDS RD | 16 | | ROOSTER CIR | 16 | | WHITE AND RIVERS RD | 16 | | BACON HILL RD | 14 | | CAMP MAC BOYKIN RD | 14 | | MILFORD PLANTATION RD | 12 | | BETHEL CHURCH RD | 10 | | CLARK ST | 10 | | LAKEISHA RD | 10 | | LANG RD | 10 | | OLD RIVER RD | 10 | | SUMMERTON HWY | 10 | | AREA DR | 8 | | CORBETT RD | 8 | | FOX TINDAL RD | 8 | | FULTONMANNING RD | 8 | | GOV RICHARDSON RD | 8 | | RAILROAD AVE | 8 | | SUMTER ST | 8 | | BOMAR TRL | 6 |
| | | Fire incidents reported |
|---|
| Sreet name | Count |
|---|
| BOYD RD | 6 | | DRAYTONMCKNIGHT RD | 6 | | EAGERTON RD | 6 | | HAMPTON ST | 6 | | HWY 261PINEWOOD HWY | 6 | | LANDS END DR | 6 | | PACKS LANDING RD | 6 | | WALLACE RD | 6 | | 1310 CORBETT ROAD | 4 | | 2NDPINEWOOD ST | 4 | | BILLUPS RD | 4 | | CELERON CIR | 4 | | CHIPMUNK LN | 4 | | DREAMERS LN | 4 | | EAST ST | 4 | | ELKHORN TRL | 4 | | GORDIN ST | 4 | | HAMPTONPWD ST | 4 | | HICKORY TOP LANDING RD | 4 | | IDLEWOOD RD | 4 | | INGRAM RD | 4 | | JULIA JAMES RD | 4 | | KANGAROO LN | 4 | | MARION ST | 4 | | |
|
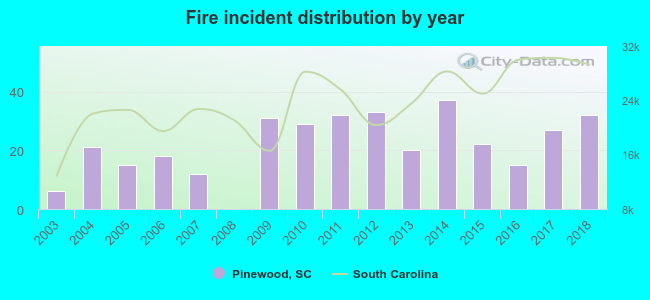 Based on the data from the years 2003 - 2018 the average number of fire incidents per year is 22. The highest number of fire incidents - 37 took place in 2014, and the least - 0 in 2008. The data has a rising trend.
 24.9% incidents where reported in the morning and 75.1% in the evening. The most fires (18.6%) took place on Monday, and the least (9.7%) on Sunday.
 According to the 350 reports from years 2003 - 2018 most fires (11.4%) took place during January, and the least (4.9%) in June.
 Out of all 749 cases reported during the years 2003 - 2018, the most belonged to the categories: Fire (46.7%), Overpressure Rupture (32.7%), and Service Call (9.3%).
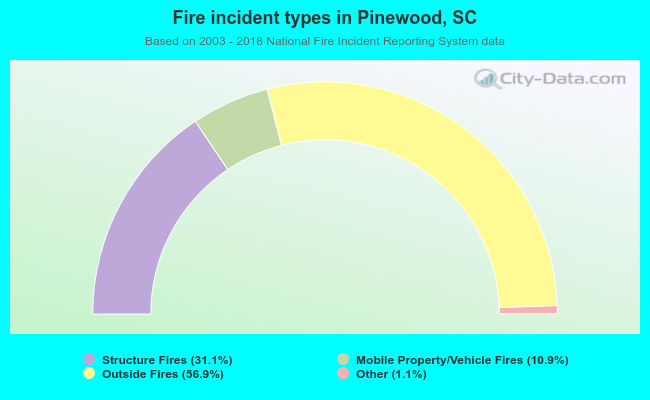 When looking into fire subcategories, the most incidents belonged to: Outside Fires (56.9%), and Structure Fires (31.1%).