| Fire incidents reported |
|---|
| Sreet name | Count |
|---|
| HWY 10 HWY | 16 | | 10 HWY | 12 | | DRAKES FORK ROAD | 12 | | HWY 10 | 12 | | HWY 399 | 10 | | DRAKES FORK RD | 8 | | HWY 112 | 8 | | HWY 113 HWY | 8 | | HWY 399 HWY | 8 | | 1501 DRAKES FORK ROAD | 6 | | 3291 HWY 458 | 6 | | ARKADELPHIA RD | 6 | | BUDDY MOORE RD | 6 | | BUNTING RD | 6 | | HWY 458 | 6 | | MARTIN RD | 6 | | SUGAR BEND RD | 6 | | TOM JEFF RD | 6 | | TOWER RD | 6 | | TURNER RD | 6 | | 1791 ARKADELPHIA RD | 4 | | 1859 GRAVEL HILL CHURCH ROAD | 4 | | AD INGALLS RD | 4 | | ARKADELPHIA RD | 4 | | BLACK JACK RD | 4 |
| | | Fire incidents reported |
|---|
| Sreet name | Count |
|---|
| DRAKES FORK RD | 4 | | HIGHWAY 10 | 4 | | HILL ST | 4 | | HWY 10 EAST | 4 | | HWY 377 HWY | 4 | | HWY 463 HWY | 4 | | LA10 | 4 | | M C MATHIS RD | 4 | | MARKEE RD | 4 | | SOAPSTONE | 4 | | T CARDY RD | 4 | | TALBERT CEM RD RD | 4 | | TURNER RD | 4 | | UNKNOWN | 4 | | WOODROW JAMES RD | 4 | | PEG MARCILE RD | 2 | | 1/4 MILE EAST | 2 | | 10 | 2 | | 110 WOODROW WINGATE ROAD | 2 | | 11085 HWY 10 | 2 | | 112 PINE DRIVE | 2 | | 113 HWY | 2 | | 113 NORTH | 2 | | 11651 LA. HWY 10 HWY | 2 | | |
|
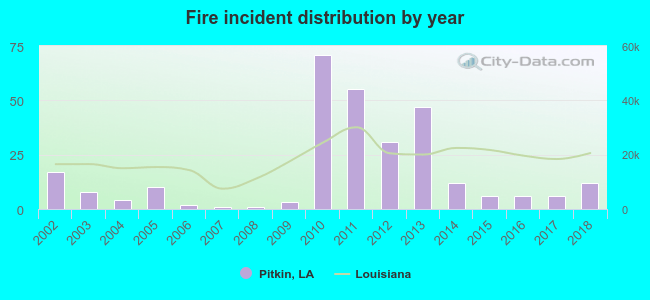 Based on the data from the years 2002 - 2018 the average number of fires per year is 17. The highest number of fire incidents - 71 took place in 2010, and the least - 1 in 2007. The data has a declining trend.
 26.7% incidents where reported in the morning and 73.3% in the evening. The most fires (16.4%) took place on Thursday, and the least (12.0%) on Saturday.
 According to the 292 fire incident reports from years 2002 - 2018 most fires (15.8%) took place during January, and the least (3.4%) in July.
 Out of all 427 cases reported during the years 2002 - 2018, the most belonged to the categories: Fire (68.4%), Overpressure Rupture (19.0%), and Service Call (4.9%).
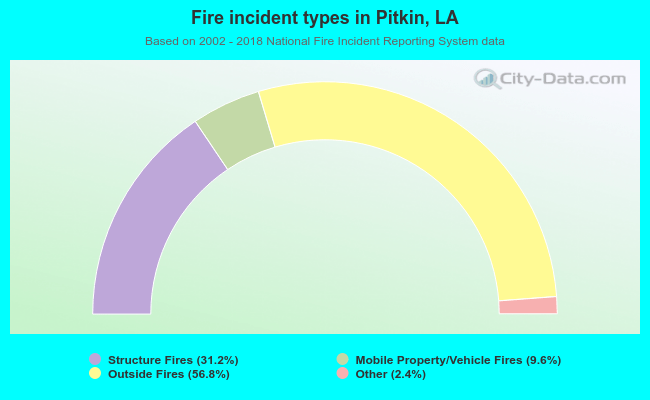 When looking into fire subcategories, the most incidents belonged to: Outside Fires (56.8%), and Structure Fires (31.2%).