| Fire incidents reported |
|---|
| Sreet name | Count |
|---|
| GALATIA POST RD | 24 | | PITTSBURG RD | 22 | | PERRY RD | 18 | | CORINTH ROAD RD | 16 | | PENNSYLVANIA AVE | 16 | | CORINTH RD | 12 | | FOWLER SCHOOL RD | 10 | | PAULTON ROAD RD | 10 | | ERVIN ST | 8 | | LIBERTY SCHOOL RD | 8 | | LOG CABIN RD | 8 | | DWINA ROAD RD | 6 | | HOCKING VALLEY AVE | 6 | | LIGHTHOUSE ROAD RD | 6 | | OAK GROVE RD | 6 | | PENNSYLVANIA AVE | 6 | | PENNSYLVANIA ST | 6 | | SCRANTON ST | 6 | | TOLEDO RD | 6 | | ANGELVILLE RD | 4 | | ANGELVILLE ROAD RD | 4 | | CHURCH ST | 4 | | CLEVELAND LN | 4 | | COLP ST | 4 | | ERVIN | 4 |
| | | Fire incidents reported |
|---|
| Sreet name | Count |
|---|
| FAIRCHILD LN | 4 | | GABBY RD | 4 | | JOCHUM LA | 4 | | JORDAN'S FORT ROAD RD | 4 | | LIGHTHOUSE RD | 4 | | NEW OHIO COAL ROAD RD | 4 | | PAULTON RD | 4 | | PITTSBURG ROAD RD | 4 | | POORDO RD | 4 | | ROCK CREEK RD | 4 | | STREETCAR ROAD RD | 4 | | 101 HOCKINGVALLEY ST | 2 | | 105 STANFORD | 2 | | 203 LEHIGH VALLEY AVE | 2 | | 208 W HOCKING VALLEY | 2 | | 303 AVERY | 2 | | ALLEGHANY RD | 2 | | AVERY | 2 | | CHURCH ST | 2 | | CLASSIC COAL RD | 2 | | CLEVELAND LA | 2 | | COLP AVE | 2 | | CULBREATH RD | 2 | | DWINA RD | 2 | | |
|
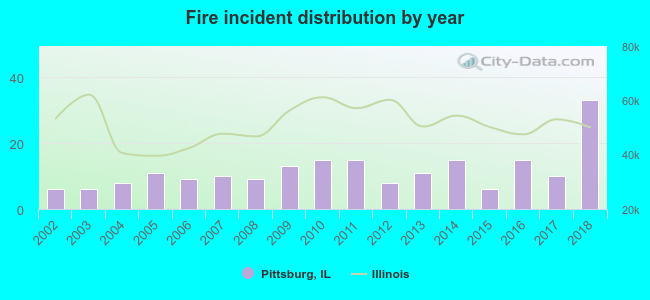 Based on the data from the years 2002 - 2018 the average number of fires per year is 12. The highest number of fire incidents - 33 took place in 2018, and the least - 6 in 2002. The data has a rising trend.
 32.5% incidents where reported in the morning and 67.5% in the evening. The most fires (23.0%) took place on Saturday, and the least (10.5%) on Monday.
 Based on the 200 reports from years 2002 - 2018 most fires (15.0%) took place during March, and the least (4.0%) in December.
 Out of all 394 cases reported during the years 2002 - 2018, the most belonged to the categories: Fire (50.8%), Overpressure Rupture (26.4%), and Rescue & EMS (9.4%).
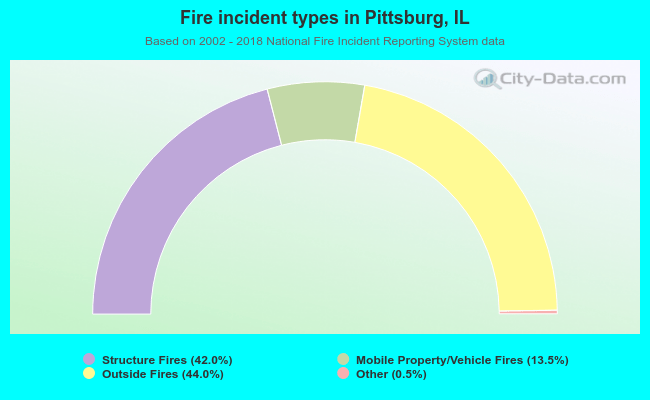 When looking into fire subcategories, the most reports belonged to: Outside Fires (44.0%), and Structure Fires (42.0%).