| Fire incidents reported |
|---|
| Sreet name | Count |
|---|
| INTERSTATE 81 | 42 | | ROUTE 315 | 34 | | RIVER STREET | 18 | | EAST END BLVD | 14 | | MAIN ST | 14 | | RIVER ST | 14 | | ROUTE 315 HWY | 14 | | ROUTE 115 | 12 | | EAST MOUNTAIN BLVD | 10 | | MAIN STREET | 10 | | MAFFETT STREET | 8 | | BALTIMORE DRIVE | 6 | | COTTON AVE | 6 | | JUMPER ROAD | 6 | | ROUTE 115 HWY | 6 | | S RIVER ST | 6 | | SECOND ST. | 6 | | WESTMINISTER ROAD | 6 | | BEAR CREEK BLVD | 4 | | E. END BLVD. | 4 | | EAST MOUNTAIN BLVD | 4 | | GALLAGHER DRIVE | 4 | | JUMPER RD. | 4 | | LAIRD ST | 4 | | LAIRD STREET | 4 |
| | | Fire incidents reported |
|---|
| Sreet name | Count |
|---|
| MAFFETT ST | 4 | | N. RIVER ST. | 4 | | OAK STREET | 4 | | OLD PITTSTON BLVD | 4 | | RIDGEWOOD ROAD | 4 | | RT 315 | 4 | | RT. 315 | 4 | | S MAIN ST | 4 | | S. RIVER ST. | 4 | | SOUTH RIVER STREET | 4 | | SUNSET DRIVE | 4 | | UNION STREET | 4 | | WILCOX ST | 4 | | WILDFLOWER DR | 4 | | 315 HWY | 2 | | 47 POPLAR ST | 2 | | 81 170 OFFRAMP | 2 | | 81 N 1716 | 2 | | 81 NB 1724 | 2 | | 81 NORTHBOUND | 2 | | ABBOTT STREET | 2 | | AMESBURY STREET | 2 | | BANK STREET | 2 | | BEAR CREEK BLVD | 2 | | BERGH STREET | 2 |
|
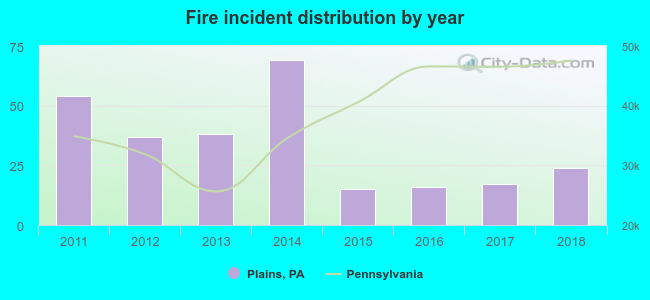 Based on the data from the years 2011 - 2018 the average number of fires per year is 34. The highest number of fires - 69 took place in 2014, and the least - 15 in 2015. The data has a declining trend.
 30.7% incidents where reported in the morning and 69.3% in the evening. The most fires (17.4%) took place on Wednesday, and the least (10.7%) on Tuesday.
 According to the 270 incident reports from years 2011 - 2018 most fires (20.0%) took place during April, and the least (4.1%) in February.
 Out of all 3,662 cases reported during the years 2011 - 2018, the most belonged to the categories: Rescue & EMS (53.7%), Hazardous Condition (9.1%), and Service Call (8.8%).
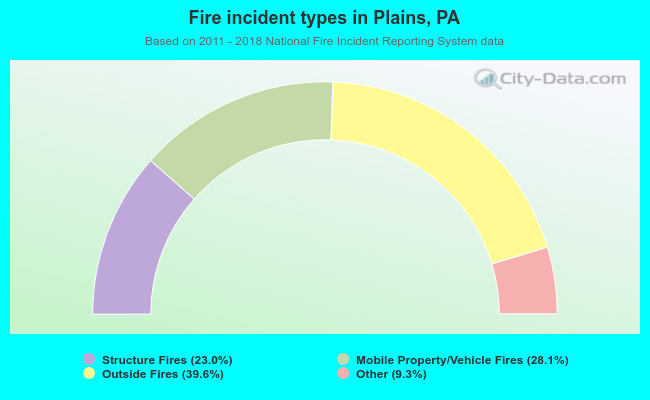 When looking into fire subcategories, the most reports belonged to: Outside Fires (39.6%), and Mobile Property/Vehicle Fires (28.1%).