Plattsburgh: Fire Incidents, New York (NY)
Where are fire incidents reported in Plattsburgh, NY
Something went wrong! Please refresh the page.
| Fire incidents reported | |
|---|---|
| Sreet name | Count |
| MUTUAL AID MORRISONVILLE | 200 |
| WEED ST | 126 |
| RUGAR ST | 120 |
| MUTUAL AID BEEKMANTOWN | 114 |
| CONSUMER SQUARE | 78 |
| MILITARY TURNPIKE RT 190 | 76 |
| CENTRE DR | 64 |
| MARGARET ST | 60 |
| WALLACE HILL RD | 58 |
| MUTUAL AID PLATTSBURGH | 48 |
| ROUTE 9 | 46 |
| SMITHFIELD BLVD | 44 |
| MUTUAL AID SOUTH PLATTS | 42 |
| ROUTE 3 | 42 |
| STATE ROUTE #3 EXPY | 40 |
| BROWN RD | 34 |
| CORNELIA ST | 34 |
| CORNELIA ST | 34 |
| ROUTE 22 | 34 |
| RUGAR ST | 34 |
| SANBORN AVENUE | 34 |
| CROSS RD | 32 |
| MA MORRISONVILLE | 30 |
| STAFFORD RD | 28 |
| CUMBERLAND HEAD ROAD | 26 |
| MUTUALAID CUMBERLAND HEAD | 26 |
| STATE ROUTE3 EXPY | 26 |
| TOM MILLER RD | 26 |
| BEEKMAN ST | 20 |
| BRINKERHOFF ST | 20 |
| Other | 404 |
2002 - 2018 National Fire Incident Reporting System (NFIRS) incidents
- Incident types reported to NFIRS in Plattsburgh, NY
- 3,58525.8%Hazardous Condition
- 3,53425.4%Rescue & EMS
- 2,41817.4%False Alarm
- 2,00014.4%Fire
- 1,0947.9%Service Call
- 1,0827.8%Good Intent Call
- 1290.9%Overpressure Rupture
- 420.3%Severe Weather
- Fire incident types reported to NFIRS in Plattsburgh, NY
- 1,14257.1%Structure Fires
- 53526.8%Outside Fires
- 1869.3%Mobile Property/Vehicle Fires
- 1376.8%Other
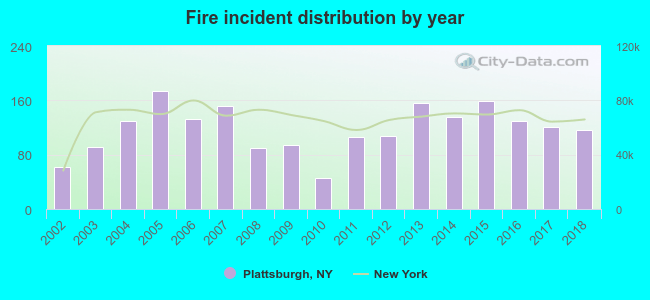 Based on the data from the years 2002 - 2018 the average number of fire incidents per year is 118. The highest number of fire incidents - 174 took place in 2005, and the least - 46 in 2010. The data has an increasing trend.
The average number of yearly fire incidents per 10k residents in Plattsburgh, NY compared to nearest cities:
(Note: Based on data for the last 3 years, including only cities with population 5,000 and above)
| Plattsburgh: | 62.0 |
| Beekmantown: | 8.4 |
| Schuyler Falls: | 19.3 |
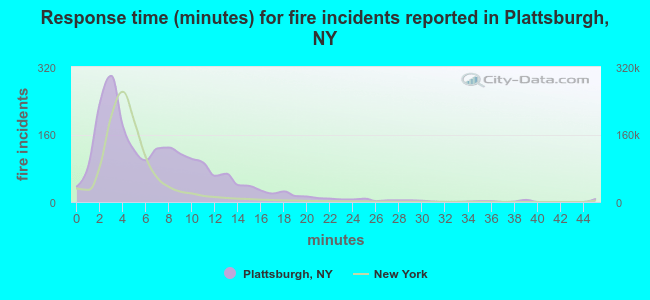 The median response time based on all reported fire incidents is 6 minutes. This is higher than the state median value.
The median response time in Plattsburgh, NY compared to nearest cities:
(Note: Based on data for all years, including only cities with at least 500 fire incidents)
| Plattsburgh: | 6 minutes |
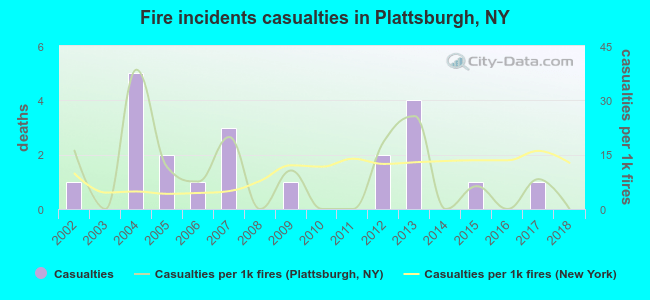 According to the data from the years 2002 - 2018 the average number of fire-related casualties per year is 1. The highest number of reported casualties - 5 took place in 2004, and the lowest - 0 in 2003. The data has a decreasing trend.
The average number of injuries per 1,000 fire incidents is 10. This indicator was the highest - 38 in 2004, and the lowest 0 in 2003. The trend for casualties per 1,000 incidents is decreasing. Compared to the state value the number of injuries per 1,000 incidents is similar.
According to the data from the years 2002 - 2018 the average number of fire-related casualties per year is 1. The highest number of reported casualties - 5 took place in 2004, and the lowest - 0 in 2003. The data has a decreasing trend.
The average number of injuries per 1,000 fire incidents is 10. This indicator was the highest - 38 in 2004, and the lowest 0 in 2003. The trend for casualties per 1,000 incidents is decreasing. Compared to the state value the number of injuries per 1,000 incidents is similar.Casualties per 1,000 incidents in Plattsburgh, NY compared to nearest cities:
(Note: Based on data for all years, including only cities with at least 500 fire incidents)
| Plattsburgh: | 10.5 |
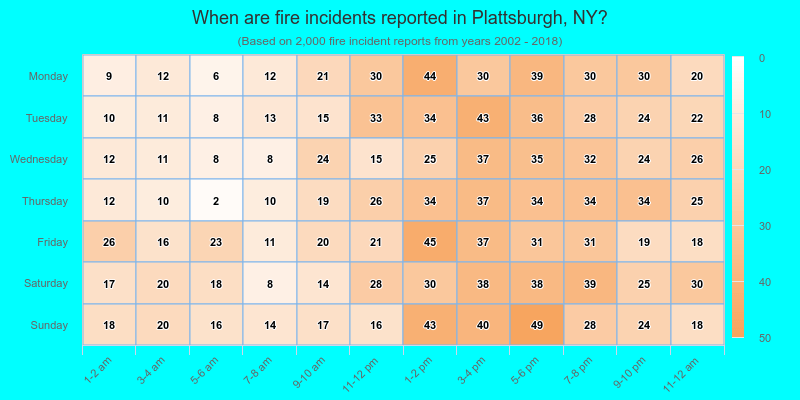
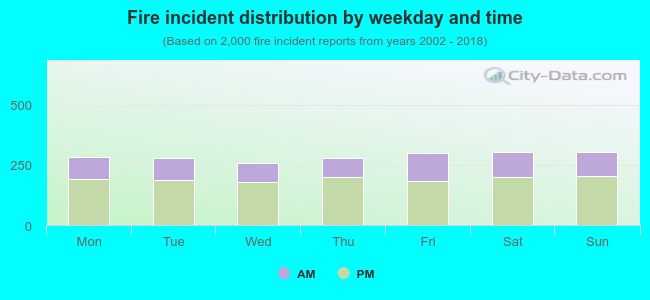 33.0% incidents where reported in the morning and 67.0% in the evening. The most fires (15.3%) took place on Saturday, and the least (12.8%) on Wednesday.
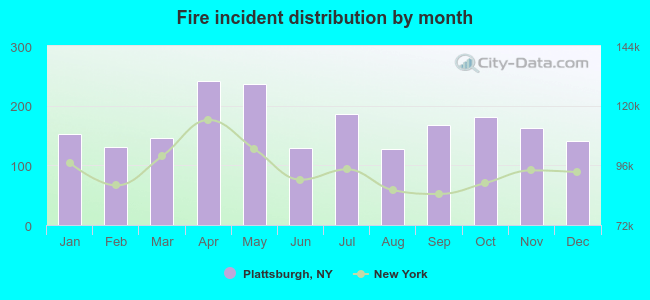 According to the 2,000 fire incident reports from years 2002 - 2018 most fires (12.1%) took place during April, and the least (6.4%) in August.
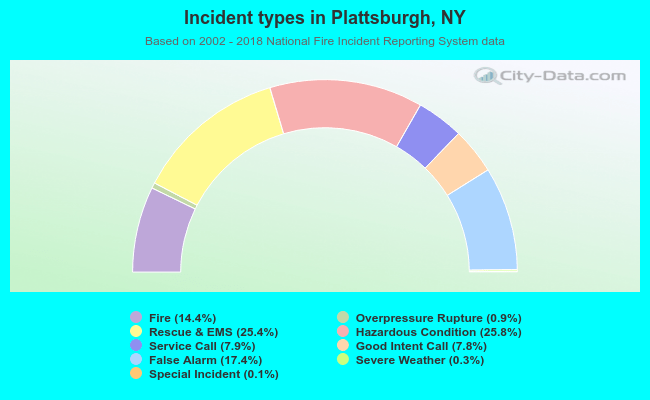 Out of all 13,896 cases reported during the years 2002 - 2018, the most belonged to the categories: Hazardous Condition (25.8%), Rescue & EMS (25.4%), and False Alarm (17.4%).
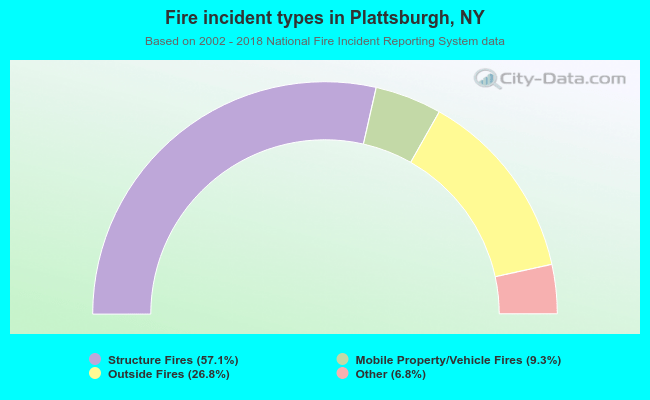 When looking into fire subcategories, the most incidents belonged to: Structure Fires (57.1%), and Outside Fires (26.8%).