| Fire incidents reported |
|---|
| Sreet name | Count |
|---|
| FARM ROAD 149 | 6 | | FARM ROAD 163 | 6 | | HIGHWAY 215 | 6 | | 1803 HWY 215 | 4 | | 564TH ROAD | 4 | | COWDEN | 4 | | EAST 530TH RD | 4 | | FARM ROAD 30 | 4 | | HWAY 215 | 4 | | MAIN STRE | 4 | | STATE HWY H | 4 | | 10429 STATE HWY H | 2 | | 105 EAST HIGHWAY 215 | 2 | | 10597 NORTH FARM RD 149 | 2 | | 1627 E FR 28 | 2 | | 1851 EAST 505TH RD | 2 | | 1885 E 530TH RD | 2 | | 188TH RD | 2 | | 188TH ROAD | 2 | | 188TH ROAD | 2 | | 1901 EAST 487TH RD | 2 | | 1916 E 555TH RD | 2 | | 192ND RD | 2 | | 1945 HIGHWAY 215 | 2 | | 1947 HIGHWAY KK | 2 |
| | | Fire incidents reported |
|---|
| Sreet name | Count |
|---|
| 1975 E 558TH RD | 2 | | 1995 E 562ND RD | 2 | | 201 SOUTH MAIN AVE | 2 | | 2018 E 562TH RD | 2 | | 2018 EAST 562 ND RD | 2 | | 2021 EAST 532ND RD | 2 | | 2055 HIGWAY Z | 2 | | 2061 HIGHWAY Z | 2 | | 207 WEST LEWIS ST. | 2 | | 2075 E 530TH RD | 2 | | 2108 E. 530TH RD. | 2 | | 210TH RD | 2 | | 212 EAST HIGHWAY 215 | 2 | | 2136 HWY Z | 2 | | 215 HWY | 2 | | 2155 E 535TH RD | 2 | | 222 RD | 2 | | 2223 515TH RD | 2 | | 222ND ROAD | 2 | | 2234 E 530TH RD | 2 | | 2237 EAST 515TH RD. | 2 | | 233RD ROAD | 2 | | 235TH ROAD | 2 | | 2397 EAST 535TH RD | 2 | | |
|
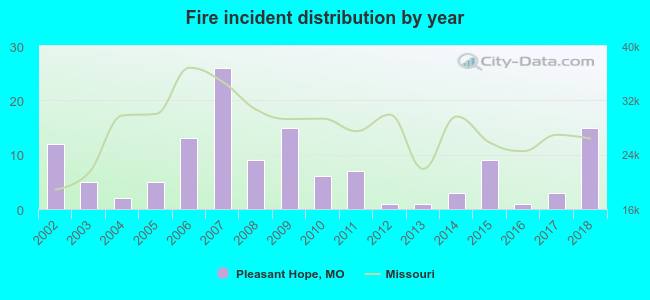 Based on the data from the years 2002 - 2018 the average number of fires per year is 8. The highest number of reported fires - 26 took place in 2007, and the least - 1 in 2012. The data has a rising trend.
 33.1% incidents where reported in the morning and 66.9% in the evening. The most fires (20.3%) took place on Friday, and the least (9.8%) on Sunday.
 Based on the 133 fire incident reports from years 2002 - 2018 most fires (18.0%) took place during January, and the least (3.0%) in May.
 Out of all 381 cases reported during the years 2002 - 2018, the most belonged to the categories: Overpressure Rupture (50.7%), Fire (34.9%), and Service Call (11.3%).
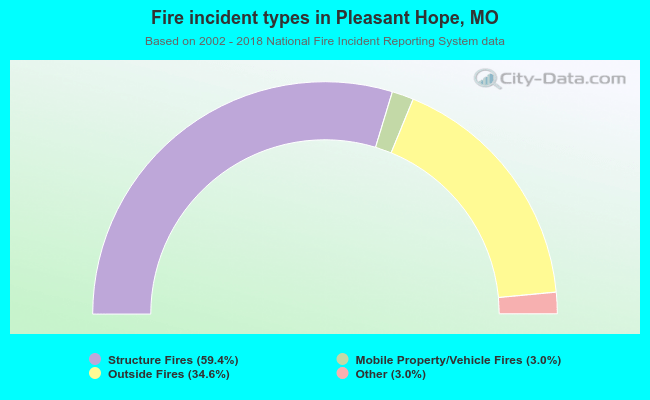 When looking into fire subcategories, the most incidents belonged to: Structure Fires (59.4%), and Outside Fires (34.6%).