Pleasant View: Fire Incidents, Tennessee (TN)
Where are fire incidents reported in Pleasant View, TN
Something went wrong! Please refresh the page.
|
| |||||||||||||||||||||||||||||||||||||||||||||||||||||||||||||||||||||||||||||||||||||||||||||||||||||||||||||
2002 - 2018 National Fire Incident Reporting System (NFIRS) incidents
- Incident types reported to NFIRS in Pleasant View, TN
- 1,07642.0%Rescue & EMS
- 47318.5%Fire
- 34513.5%Good Intent Call
- 26910.5%Hazardous Condition
- 2118.2%False Alarm
- 1706.6%Service Call
- 100.4%Severe Weather
- 60.2%Overpressure Rupture
- 30.1%Special Incident
- Fire incident types reported to NFIRS in Pleasant View, TN
- 19942.1%Outside Fires
- 15131.9%Structure Fires
- 11524.3%Mobile Property/Vehicle Fires
- 81.7%Other
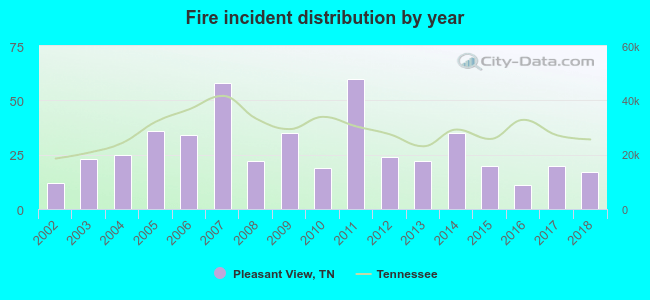 Based on the data from the years 2002 - 2018 the average number of fires per year is 28. The highest number of fire incidents - 60 took place in 2011, and the least - 11 in 2016. The data has an increasing trend.
 Based on the data from the years 2002 - 2018 the average number of fire-related fatalities per year is 0. The highest number of reported deaths - 2 took place in 2002, and the lowest - 0 in 2003. The data has a dropping trend.
 Based on the data from the years 2002 - 2018 the average number of fire-related casualties per year is 1. The highest number of reported injuries - 3 took place in 2003, and the lowest - 0 in 2002. The data has an increasing trend.
 30.9% incidents where reported in the morning and 69.1% in the evening. The most fires (17.1%) took place on Wednesday, and the least (12.3%) on Thursday.
 According to the 473 reports from years 2002 - 2018 most fires (11.4%) took place during March, and the least (5.7%) in June.
 Out of all 2,563 cases reported during the years 2002 - 2018, the most belonged to the categories: Rescue & EMS (42.0%), Fire (18.5%), and Good Intent Call (13.5%).
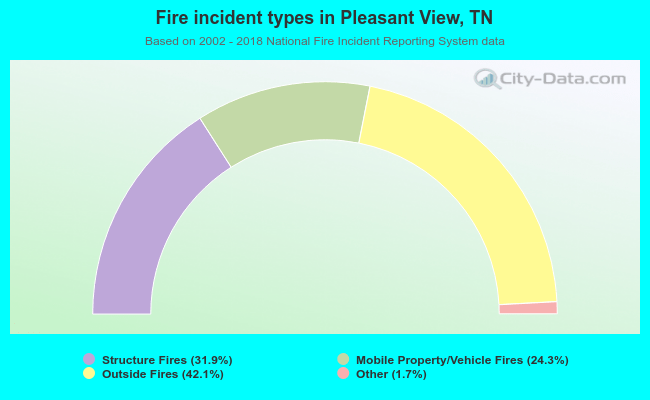 When looking into fire subcategories, the most incidents belonged to: Outside Fires (42.1%), and Structure Fires (31.9%).