| Fire incidents reported |
|---|
| Sreet name | Count |
|---|
| MANN RD | 16 | | 1ST AVE | 12 | | HWY 5 HWY | 8 | | MANN ROAD RD | 8 | | SHIPPE CANYON RD | 8 | | BOX ELDER LOOP RD | 6 | | HIWAY 5E | 6 | | JACKSON ST | 6 | | JENTORE RD | 6 | | MAIN ST | 6 | | SUNNYSIDE AVE | 6 | | 151 SUNRISE RD | 4 | | 233 S CHESTNUT | 4 | | 74 TRINITY RD | 4 | | ADAMS ST | 4 | | BOUNDARY AVE | 4 | | CENTRAL AVE | 4 | | DOOLEY RD | 4 | | HORSESHOE DR | 4 | | HWY 16 S | 4 | | INCLINE RD | 4 | | LAUREL AVE | 4 | | MARRON CREEK RD | 4 | | MAURICE ST | 4 | | NORTHERN AVE | 4 |
| | | Fire incidents reported |
|---|
| Sreet name | Count |
|---|
| OLIVE ST | 4 | | OLIVE ST | 4 | | RAYMOND RD | 4 | | S COMERTOWN RD | 4 | | S JEFFERSON ST | 4 | | S MAIN STREET ST | 4 | | SHERIDAN ST | 4 | | SHIPPE CANYON RD | 4 | | SUNRISE RD | 4 | | WASHINGTON ST | 4 | | WELLIVER RD | 4 | | WELLIVER ROAD RD | 4 | | 101 KINGS HILL | 2 | | 111 N MAIN | 2 | | 114 S ADAMS ST | 2 | | 117 N JEFFERSON ST | 2 | | 117 W 1ST AVE | 2 | | 118 S MAIN ST | 2 | | 12 NICHOLS ROAD | 2 | | 121 NORTH ADAMS STREET ST | 2 | | 121 W SOUTHERN AVE | 2 | | 122 W LAUREL AVE | 2 | | 1425 BOLSTER RD | 2 | | 16 HIGH | 2 | | |
|
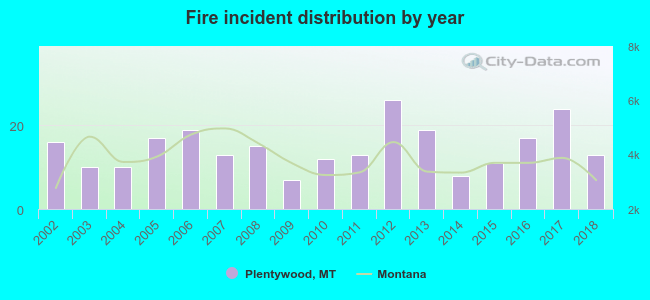 Based on the data from the years 2002 - 2018 the average number of fire incidents per year is 15. The highest number of reported fires - 26 took place in 2012, and the least - 7 in 2009. The data has a dropping trend.
 29.2% incidents where reported in the morning and 70.8% in the evening. The most fires (16.8%) took place on Saturday, and the least (12.0%) on Sunday.
 According to the 250 fire incidents from years 2002 - 2018 most fires (19.2%) took place during July, and the least (2.4%) in March.
 Out of all 523 cases reported during the years 2002 - 2018, the most belonged to the categories: Fire (47.8%), False Alarm (17.6%), and Hazardous Condition (15.1%).
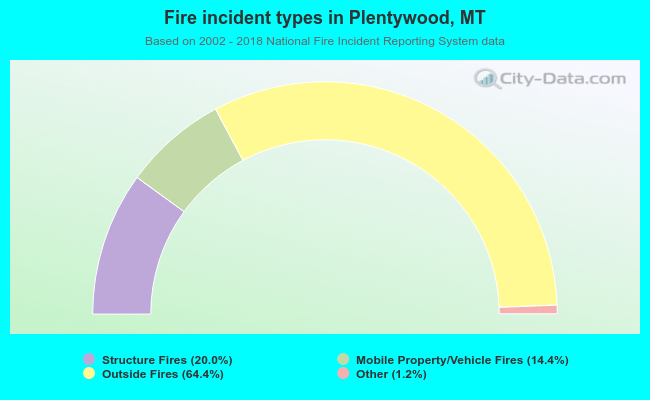 When looking into fire subcategories, the most reports belonged to: Outside Fires (64.4%), and Structure Fires (20.0%).