Plymouth: Fire Incidents, Ohio (OH)
Where are fire incidents reported in Plymouth, OH
Something went wrong! Please refresh the page.
|
| |||||||||||||||||||||||||||||||||||||||||||||||||||||||||||||||||||||||||||||||||||||||||||||||||||||||||||||
2002 - 2018 National Fire Incident Reporting System (NFIRS) incidents
- Incident types reported to NFIRS in Plymouth, OH
- 81058.9%Rescue & EMS
- 30722.3%Fire
- 815.9%Hazardous Condition
- 775.6%Good Intent Call
- 715.2%Service Call
- 201.5%False Alarm
- 50.4%Severe Weather
- 50.4%Special Incident
- Fire incident types reported to NFIRS in Plymouth, OH
- 17858.0%Structure Fires
- 9430.6%Outside Fires
- 3110.1%Mobile Property/Vehicle Fires
- 41.3%Other
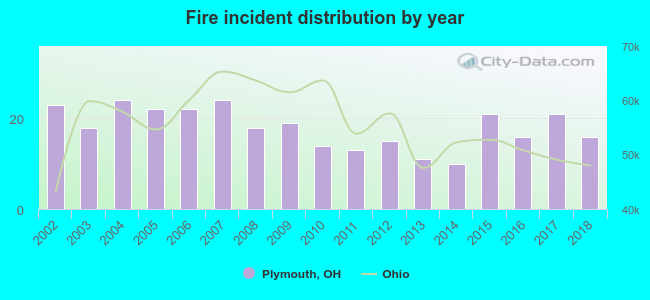 Based on the data from the years 2002 - 2018 the average number of fire incidents per year is 18. The highest number of fire incidents - 24 took place in 2004, and the least - 10 in 2014. The data has a dropping trend.
 33.9% incidents where reported in the morning and 66.1% in the evening. The most fires (16.6%) took place on Tuesday, and the least (12.7%) on Saturday.
 According to the 307 fire incident reports from years 2002 - 2018 most fires (13.7%) took place during November, and the least (5.2%) in August.
 Out of all 1,376 cases reported during the years 2002 - 2018, the most belonged to the categories: Overpressure Rupture (58.9%), Fire (22.3%), and Rescue & EMS (5.9%).
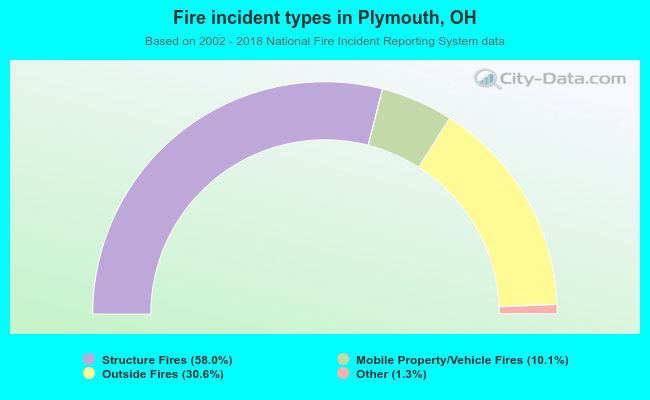 When looking into fire subcategories, the most incidents belonged to: Structure Fires (58.0%), and Outside Fires (30.6%).