Pollock Pines: Fire Incidents, California (CA)
Where are fire incidents reported in Pollock Pines, CA
Something went wrong! Please refresh the page.
|
| |||||||||||||||||||||||||||||||||||||||||||||||||||||||||||||||||||||||||||||||||||||||||||||||||||||||||||||
2005 - 2018 National Fire Incident Reporting System (NFIRS) incidents
- Incident types reported to NFIRS in Pollock Pines, CA
- 2,74264.9%Rescue & EMS
- 55413.1%Service Call
- 2906.9%Fire
- 2796.6%Good Intent Call
- 2325.5%Hazardous Condition
- 1182.8%False Alarm
- 50.1%Special Incident
- Fire incident types reported to NFIRS in Pollock Pines, CA
- 15754.1%Outside Fires
- 8429.0%Structure Fires
- 3211.0%Mobile Property/Vehicle Fires
- 175.9%Other
 Based on the data from the years 2005 - 2018 the average number of fire incidents per year is 21. The highest number of fires - 39 took place in 2017, and the least - 0 in 2013. The data has a growing trend.
The average number of yearly fire incidents per 10k residents in Pollock Pines, CA compared to nearest cities:
(Note: Based on data for the last 3 years, including only cities with population 5,000 and above)
| Pollock Pines: | 48.0 |
| Placerville: | 119.4 |
| Diamond Springs: | 11.8 |
| Cameron Park: | 17.6 |
| El Dorado Hills: | 24.3 |
| Auburn: | 84.0 |
| Folsom: | 7.3 |
| Granite Bay: | 28.4 |
| Rancho Murieta: | 34.6 |

 According to the data from the years 2005 - 2018 the average number of fire-related yearly casualties is 1. The highest number of reported injuries - 2 took place in 2008, and the lowest - 0 in 2006. The data has a declining trend.
 35.9% incidents where reported in the morning and 64.1% in the evening. The most fires (17.2%) took place on Saturday, and the least (11.0%) on Tuesday.
 Based on the 290 incident reports from years 2005 - 2018 most fires (13.4%) took place during September, and the least (6.6%) in December.
 Out of all 4,225 cases reported during the years 2005 - 2018, the most belonged to the categories: Rescue & EMS (64.9%), Service Call (13.1%), and Fire (6.9%).
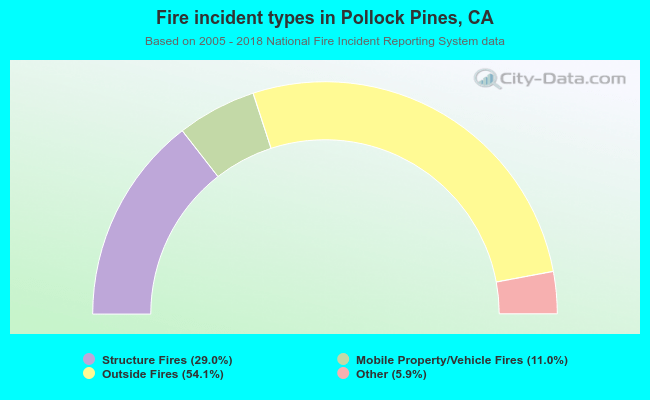 When looking into fire subcategories, the most incidents belonged to: Outside Fires (54.1%), and Structure Fires (29.0%).