| Fire incidents reported |
|---|
| Sreet name | Count |
|---|
| EAGLE VALLEY RD | 44 | | MOUNTAIN RD | 42 | | HALFMOON VALLEY RD | 38 | | PLANK RD | 20 | | BELL HOLLOW LN | 16 | | I99 SOUTH | 16 | | FOWLER HOLLOW LN | 12 | | NEARHOOF LN | 12 | | SAWMILL RD | 12 | | I99 NORTH | 10 | | STEELE HOLLOW RD | 10 | | HILLTOP LN | 8 | | LAUREL RUN RD | 8 | | SKYTOP MOUNTAIN RD | 8 | | SUNNYSIDE HOLLOW RD | 8 | | BUFFALO RUN RD | 6 | | FRONT ST | 6 | | HARVARD RD | 6 | | HERITAGE LN | 6 | | I99 | 6 | | ORCHARD RD | 6 | | SADDLE RIDGE RD | 6 | | DARIUS LN | 4 | | DIX RUN RD | 4 | | FLAT ROCK RD | 4 |
| | | Fire incidents reported |
|---|
| Sreet name | Count |
|---|
| GATESBURG RD | 4 | | HEMLOCK DR | 4 | | HERITAGE TRAIL RD | 4 | | LOWER JULIAN PIKE | 4 | | MAIN ST | 4 | | MARENGO RD | 4 | | MUDLICK RD | 4 | | ORVIS BECKWITH LN | 4 | | PORT MATILDA HWY | 4 | | REESE HOLLOW RD | 4 | | RHODES FARM LN | 4 | | RICHARDS LN | 4 | | SILVERDALE RD | 4 | | SKY HARBOR DR | 4 | | WOOD ST | 4 | | ADAMS ST | 2 | | ARDERY HOLLOW RD | 2 | | ATHERTON ST | 2 | | AUTUMN CIR | 2 | | BAUGHMAN CEMETERY RD | 2 | | BEAVER RD | 2 | | BELL HOLW | 2 | | BELLHOLLOW RD | 2 | | BLACK MOSHANNON RD | 2 | | |
|
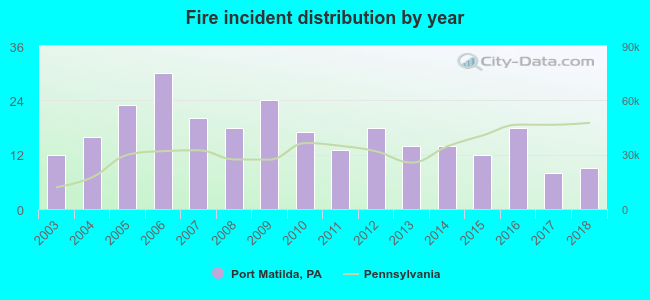 Based on the data from the years 2003 - 2018 the average number of fires per year is 17. The highest number of fires - 30 took place in 2006, and the least - 8 in 2017. The data has a declining trend.
 30.8% incidents where reported in the morning and 69.2% in the evening. The most fires (19.5%) took place on Thursday, and the least (11.3%) on Monday.
 According to the 266 incident reports from years 2003 - 2018 most fires (14.7%) took place during April, and the least (3.4%) in August.
 Out of all 679 cases reported during the years 2003 - 2018, the most belonged to the categories: Fire (39.2%), Hazardous Condition (20.2%), and Rescue & EMS (13.5%).
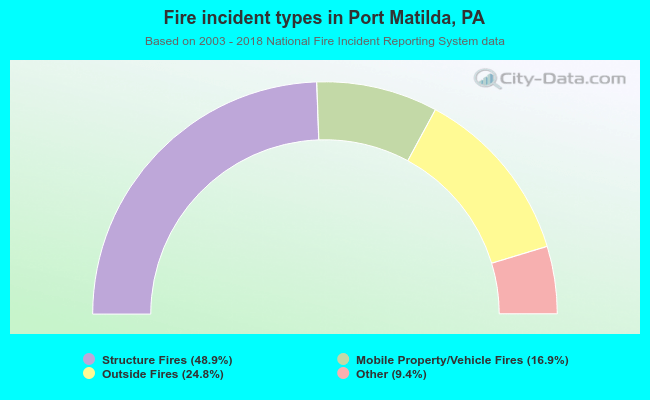 When looking into fire subcategories, the most reports belonged to: Structure Fires (48.9%), and Outside Fires (24.8%).