Portage: Fire Incidents, Michigan (MI)
Where are fire incidents reported in Portage, MI
Something went wrong! Please refresh the page.
| Fire incidents reported | |
|---|---|
| Sreet name | Count |
| WESTNEDGE | 160 |
| CENTRE | 88 |
| PORTAGE | 76 |
| CURRIER | 70 |
| MILHAM | 64 |
| MEREDITH | 48 |
| 94 WB | 46 |
| OAKLAND | 46 |
| SPRINKLE | 44 |
| 131 SB | 40 |
| SHAVER | 36 |
| 94 EB | 34 |
| WESTNEDGE AVE | 32 |
| PORTAGE RD | 30 |
| VANDERBILT | 28 |
| ANGLING | 26 |
| 131 NB | 24 |
| CONSTITUTION | 22 |
| OAKLAND DR | 22 |
| ROMENCE | 22 |
| LOVERS LANE | 20 |
| KILGORE | 18 |
| WHISPERING BROOK | 18 |
| MALL | 16 |
| MEREDITH ST | 16 |
| SHAVER RD | 16 |
| CENTRE AVE | 14 |
| HELEN AVE | 12 |
| ROMENCE RD | 12 |
| VANDERBILT AVE | 12 |
| Other | 117 |
2002 - 2018 National Fire Incident Reporting System (NFIRS) incidents
- Incident types reported to NFIRS in Portage, MI
- 11,15349.3%Rescue & EMS
- 4,42519.6%Good Intent Call
- 2,26810.0%Service Call
- 1,9548.6%Hazardous Condition
- 1,4716.5%False Alarm
- 1,2295.4%Fire
- 1080.5%Overpressure Rupture
- Fire incident types reported to NFIRS in Portage, MI
- 66954.4%Structure Fires
- 29924.3%Outside Fires
- 22017.9%Mobile Property/Vehicle Fires
- 413.3%Other
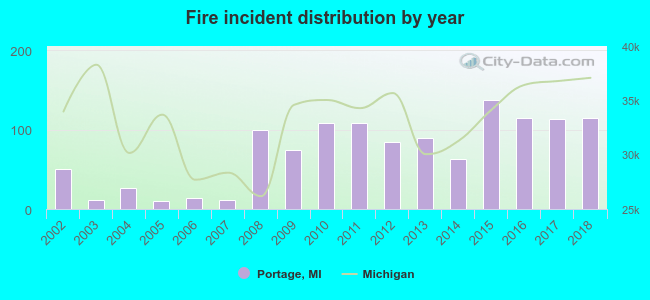 Based on the data from the years 2002 - 2018 the average number of fire incidents per year is 72. The highest number of fire incidents - 137 took place in 2015, and the least - 10 in 2005. The data has an increasing trend.
The average number of yearly fire incidents per 10k residents in Portage, MI compared to nearest cities:
(Note: Based on data for the last 3 years, including only cities with population 5,000 and above)
| Portage: | 23.9 |
| Kalamazoo: | 79.9 |
| Three Rivers: | 23.2 |
| Springfield: | 46.1 |
| Battle Creek: | 54.7 |
| Allegan: | 153.8 |
| Sturgis: | 11.0 |
| Dowagiac: | 121.2 |
| Marshall: | 75.8 |
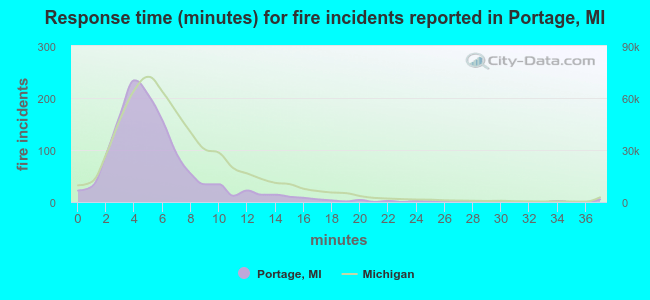 The median response time based on all reported fire incidents is 5 minutes. This is lower than the state median value.
The median response time in Portage, MI compared to nearest cities:
(Note: Based on data for all years, including only cities with at least 500 fire incidents)
| Portage: | 5 minutes |
| Kalamazoo: | 4 minutes |
| Vicksburg: | 8 minutes |
| Richland: | 6 minutes |
| Paw Paw: | 5 minutes |
| Plainwell: | 7 minutes |
| Three Rivers: | 5 minutes |
| Decatur: | 8 minutes |
| Battle Creek: | 5 minutes |
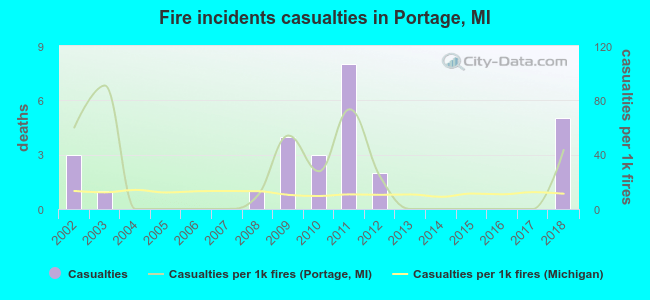 According to the reports from the years 2002 - 2018 the average number of fire-related casualties per year is 2. The highest number of casualties - 8 took place in 2011, and the lowest - 0 in 2004. The data has a rising trend.
The average number of casualties per 1,000 fire incidents is 23. This indicator was the highest - 91 in 2003, and the lowest 0 in 2004. The trend for casualties per 1,000 fires is declining. Compared to the Michigan value the number of casualties per 1,000 fires is higher.
According to the reports from the years 2002 - 2018 the average number of fire-related casualties per year is 2. The highest number of casualties - 8 took place in 2011, and the lowest - 0 in 2004. The data has a rising trend.
The average number of casualties per 1,000 fire incidents is 23. This indicator was the highest - 91 in 2003, and the lowest 0 in 2004. The trend for casualties per 1,000 fires is declining. Compared to the Michigan value the number of casualties per 1,000 fires is higher.Casualties per 1,000 incidents in Portage, MI compared to nearest cities:
(Note: Based on data for all years, including only cities with at least 500 fire incidents)
| Portage: | 22.0 |
| Kalamazoo: | 17.8 |
| Vicksburg: | 3.4 |
| Richland: | 9.1 |
| Paw Paw: | 1.4 |
| Plainwell: | 5.3 |
| Three Rivers: | 7.4 |
| Decatur: | 1.8 |
| Battle Creek: | 13.2 |
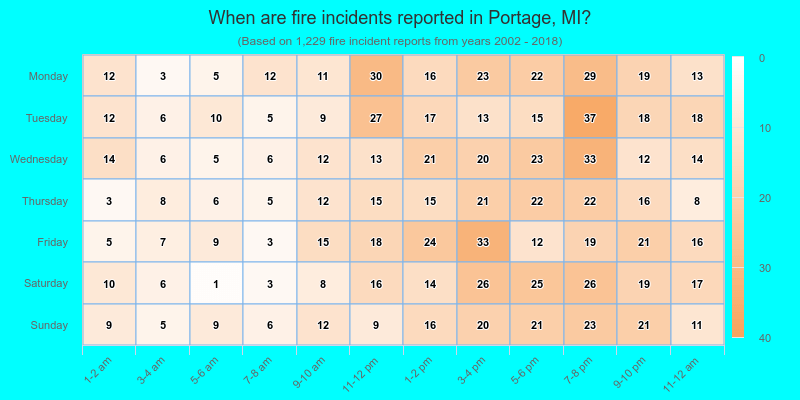
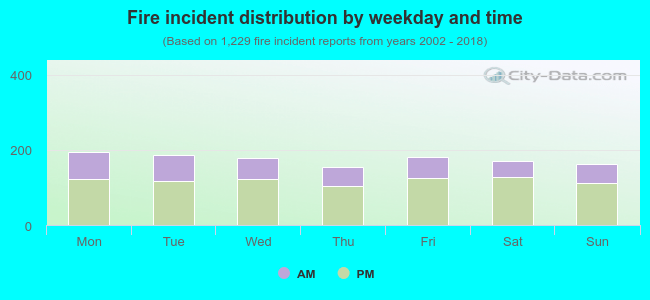 32.4% incidents where reported in the morning and 67.6% in the evening. The most fires (15.9%) took place on Monday, and the least (12.4%) on Thursday.
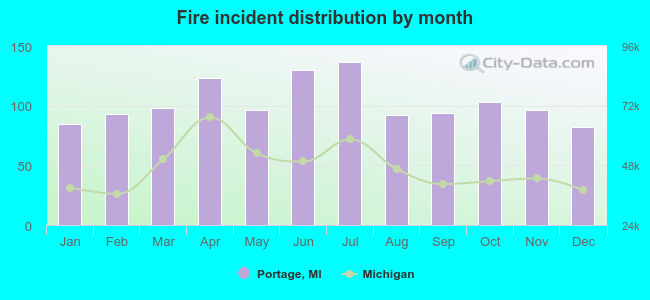 According to the 1,229 fire incident reports from years 2002 - 2018 most fires (11.1%) took place during July, and the least (6.7%) in December.
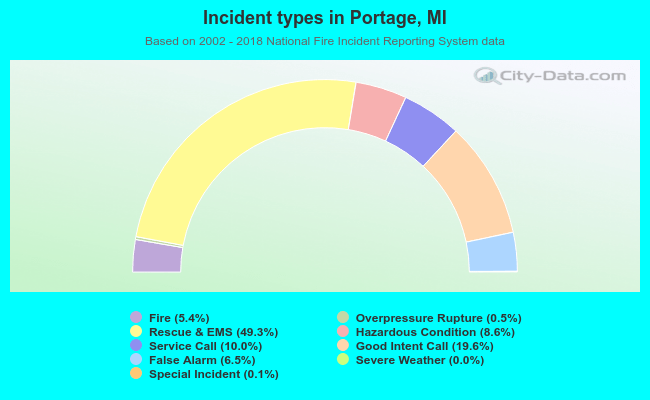 Out of all 22,632 cases reported during the years 2002 - 2018, the most belonged to the categories: Rescue & EMS (49.3%), Good Intent Call (19.6%), and Service Call (10.0%).
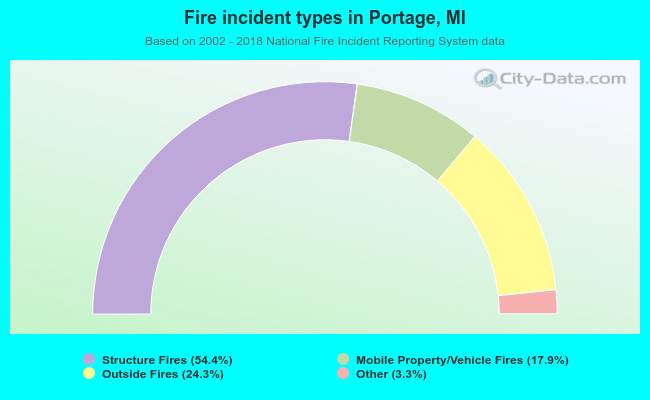 When looking into fire subcategories, the most reports belonged to: Structure Fires (54.4%), and Outside Fires (24.3%).