Portsmouth: Fire Incidents, Rhode Island (RI)
Where are fire incidents reported in Portsmouth, RI
Something went wrong! Please refresh the page.
|
| |||||||||||||||||||||||||||||||||||||||||||||||||||||||||||||||||||||||||||||||||||||||||||||||||||||||||||||
2008 - 2018 National Fire Incident Reporting System (NFIRS) incidents
- Incident types reported to NFIRS in Portsmouth, RI
- 5,33464.6%Rescue & EMS
- 1,02512.4%False Alarm
- 5957.2%Service Call
- 4986.0%Hazardous Condition
- 3894.7%Good Intent Call
- 3784.6%Fire
- 420.5%Special Incident
- Fire incident types reported to NFIRS in Portsmouth, RI
- 21957.9%Structure Fires
- 8021.2%Outside Fires
- 4812.7%Mobile Property/Vehicle Fires
- 318.2%Other
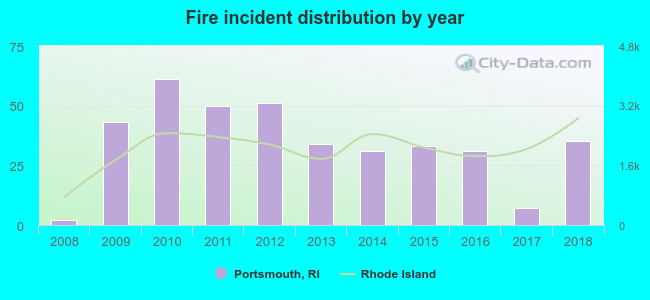 Based on the data from the years 2008 - 2018 the average number of fire incidents per year is 34. The highest number of fires - 61 took place in 2010, and the least - 2 in 2008. The data has a growing trend.
The average number of yearly fire incidents per 10k residents in Portsmouth, RI compared to nearest cities:
(Note: Based on data for the last 3 years, including only cities with population 5,000 and above)
| Portsmouth: | 14.0 |
| Tiverton: | 43.7 |
| Bristol: | 54.8 |
| Middletown: | 27.0 |
| Jamestown: | 16.7 |
| Newport: | 19.2 |
| North Kingstown: | 5.3 |
| Barrington: | 5.4 |
| Warwick: | 0.3 |
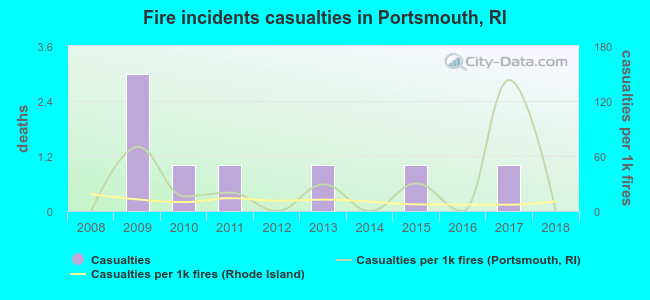 According to the data from the years 2008 - 2018 the average number of fire-related casualties per year is 1. The highest number of injuries - 3 took place in 2009, and the lowest - 0 in 2008. The data has a constant trend.
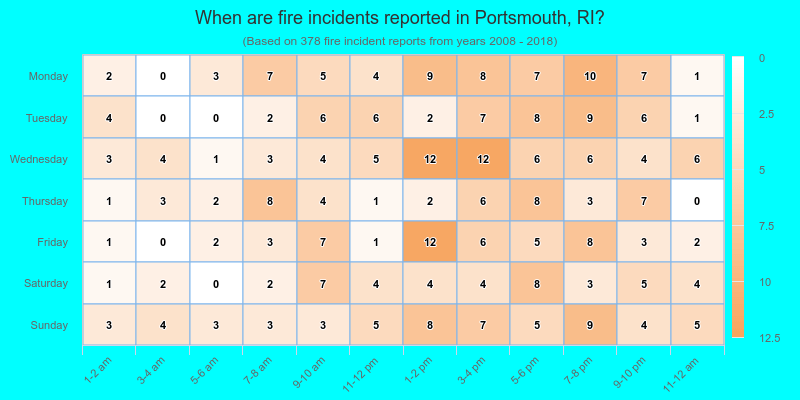
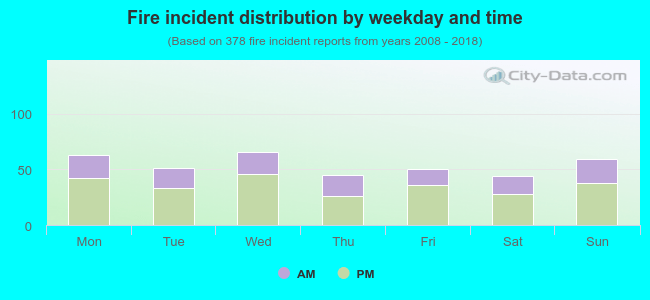 34.1% incidents where reported in the morning and 65.9% in the evening. The most fires (17.5%) took place on Wednesday, and the least (11.6%) on Saturday.
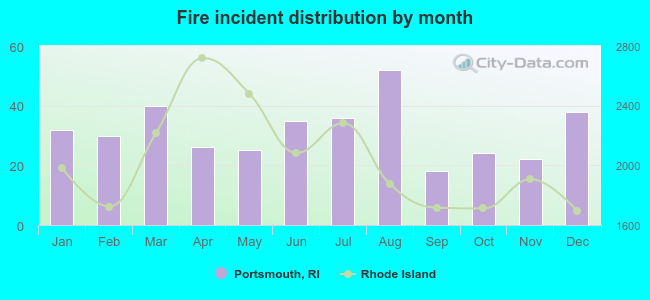 According to the 378 fire incidents from years 2008 - 2018 most fires (13.8%) took place during August, and the least (4.8%) in September.
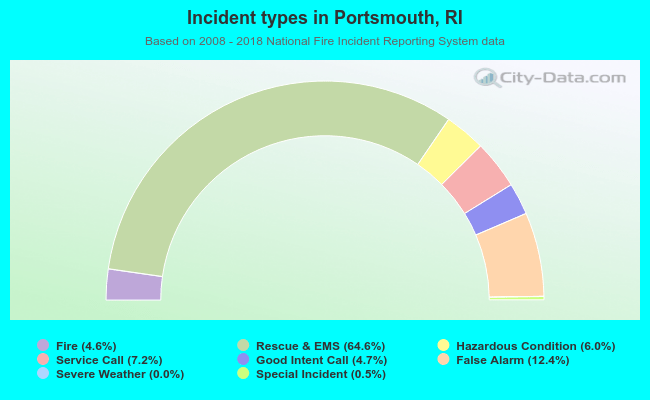 Out of all 8,262 cases reported during the years 2008 - 2018, the most belonged to the categories: Overpressure Rupture (64.6%), Good Intent Call (12.4%), and Hazardous Condition (7.2%).
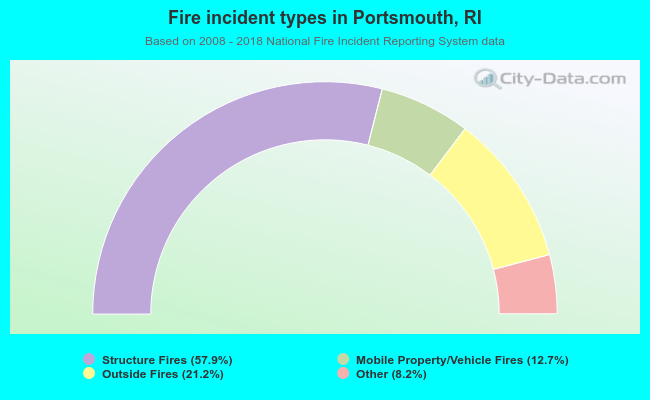 When looking into fire subcategories, the most reports belonged to: Structure Fires (57.9%), and Outside Fires (21.2%).