| Fire incidents reported |
|---|
| Sreet name | Count |
|---|
| 3580 OAK RD | 20 | | HWY 133 | 12 | | HWY 61 | 8 | | 6724 REYNOLDS RIDGE RD | 6 | | BIG PLATTE RD | 6 | | KRESS LANE | 6 | | RIVER LANE ROAD | 6 | | 4252 KELLY LANE | 4 | | 6508 CTY N | 4 | | 6694 DOGTAIL RD | 4 | | BIG PLATTE ROAD | 4 | | COUNTY HWY U | 4 | | CTY N | 4 | | HWY 133 COUNTY N | 4 | | HWY 61 NORTH | 4 | | IRISH HOLLOW RD | 4 | | OLD POTOSI ROAD | 4 | | POTOSI | 4 | | RIVER LANE | 4 | | SLAZING ROAD | 4 | | SOUTH MAIN STREET | 4 | | WEST BANFIELD RD | 4 | | 103 TENNYSON ST. | 2 | | 107 SPRUCE DRIVE | 2 | | 108 EAST ST | 2 |
| | | Fire incidents reported |
|---|
| Sreet name | Count |
|---|
| 109 EAST ST | 2 | | 109 EAST STREET | 2 | | 109 MAIN ST | 2 | | 110 MILKE DRIVE | 2 | | 118 EAST ST. | 2 | | 121 SOUTH MAIN ST | 2 | | 132 EAST STREET | 2 | | 133 SLAZING RD | 2 | | 149 EAST ST | 2 | | 199 SOUTH MAIN ST | 2 | | 3080 DARK LANE | 2 | | 3139 KRESS LANE | 2 | | 338 HWY 3561 | 2 | | 3515 INDIAN CREEK RD | 2 | | 3517 INDIAN CREEK RD | 2 | | 3580 OAK RD | 2 | | 3916 INDIAN CREEK ROAD | 2 | | 3948 HWY 61 | 2 | | 3983 COUNTY O | 2 | | 4049 HWY. 61-35 NORTH | 2 | | 4070 OAK RD. | 2 | | 4103 CTY B | 2 | | 4138 HWY 35/61 | 2 | | 4179 ELM RD | 2 | | |
|
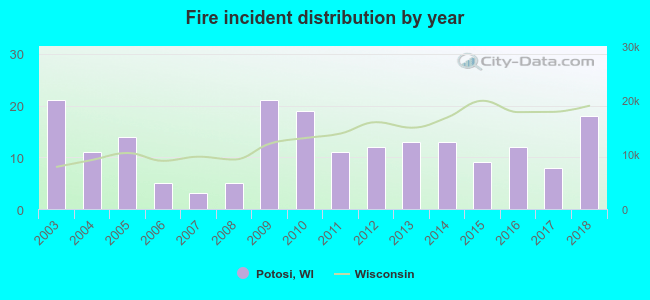 According to the data from the years 2003 - 2018 the average number of fires per year is 12. The highest number of reported fires - 21 took place in 2003, and the least - 3 in 2007. The data has a declining trend.
 27.7% incidents where reported in the morning and 72.3% in the evening. The most fires (17.4%) took place on Sunday, and the least (11.3%) on Friday.
 Based on the 195 fire incident reports from years 2003 - 2018 most fires (20.5%) took place during April, and the least (3.6%) in July.
 Out of all 338 cases reported during the years 2003 - 2018, the most belonged to the categories: Fire (57.7%), Overpressure Rupture (16.6%), and False Alarm (6.2%).
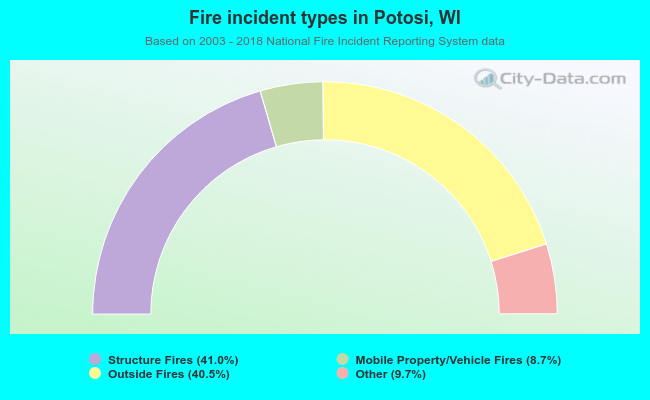 When looking into fire subcategories, the most incidents belonged to: Structure Fires (41.0%), and Outside Fires (40.5%).