Pottsville: Fire Incidents, Pennsylvania (PA)
Where are fire incidents reported in Pottsville, PA
Something went wrong! Please refresh the page.
|
| |||||||||||||||||||||||||||||||||||||||||||||||||||||||||||||||||||||||||||||||||||||||||||||||||||||||||||||
2003 - 2018 National Fire Incident Reporting System (NFIRS) incidents
- Incident types reported to NFIRS in Pottsville, PA
- 1,14324.8%False Alarm
- 1,06823.1%Fire
- 79717.3%Rescue & EMS
- 65314.2%Hazardous Condition
- 3878.4%Service Call
- 3848.3%Good Intent Call
- 962.1%Special Incident
- 721.6%Severe Weather
- 140.3%Overpressure Rupture
- Fire incident types reported to NFIRS in Pottsville, PA
- 74269.5%Structure Fires
- 13612.7%Other
- 1049.7%Mobile Property/Vehicle Fires
- 868.1%Outside Fires
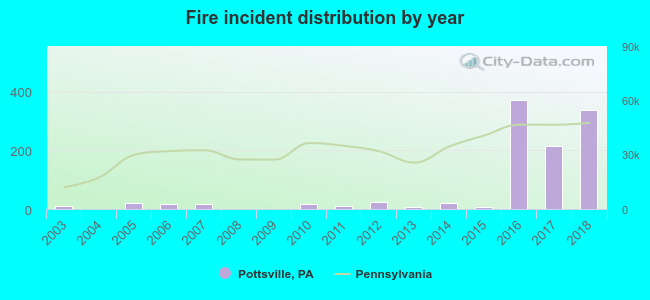 Based on the data from the years 2003 - 2018 the average number of fires per year is 67. The highest number of reported fire incidents - 370 took place in 2016, and the least - 0 in 2004. The data has a growing trend.
The average number of yearly fire incidents per 10k residents in Pottsville, PA compared to nearest cities:
(Note: Based on data for the last 3 years, including only cities with population 5,000 and above)
| Pottsville: | 220.0 |
| Schuylkill Haven: | 99.7 |
| Mount Carmel: | 32.8 |
| Tamaqua: | 104.4 |
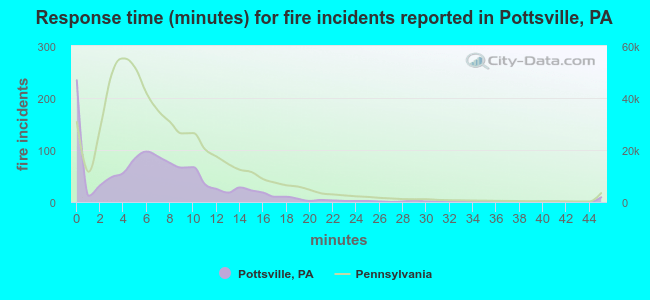 The median response time based on all reported fire incidents is 6 minutes. This is close to the state median value.
The median response time in Pottsville, PA compared to nearest cities:
(Note: Based on data for all years, including only cities with at least 500 fire incidents)
| Pottsville: | 6 minutes |
| Hamburg: | 11 minutes |
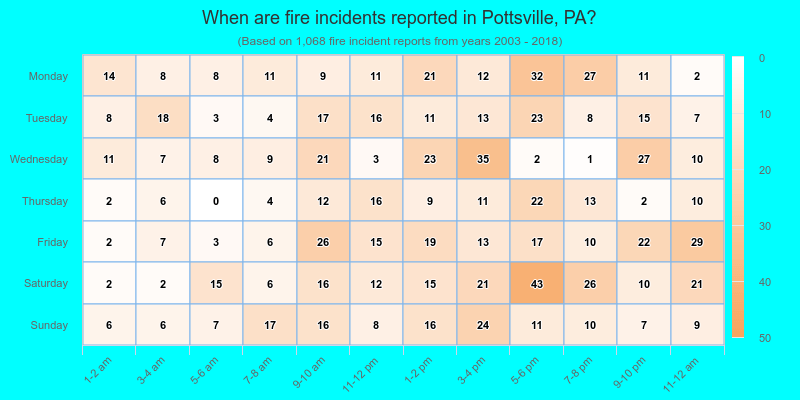
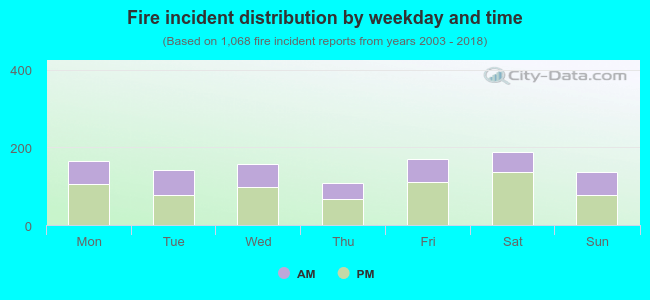 37.3% incidents where reported in the morning and 62.7% in the evening. The most fires (17.7%) took place on Saturday, and the least (10.0%) on Thursday.
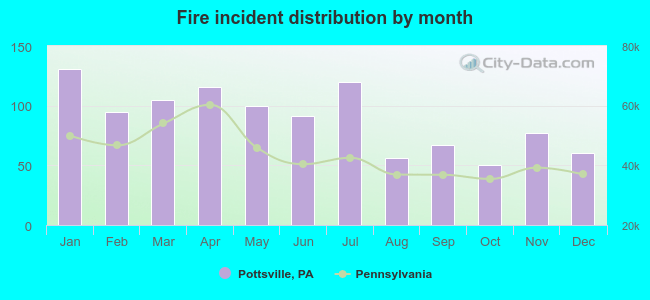 According to the 1,068 incident reports from years 2003 - 2018 most fires (12.3%) took place during January, and the least (4.7%) in October.
 Out of all 4,614 cases reported during the years 2003 - 2018, the most belonged to the categories: False Alarm (24.8%), Fire (23.1%), and Rescue & EMS (17.3%).
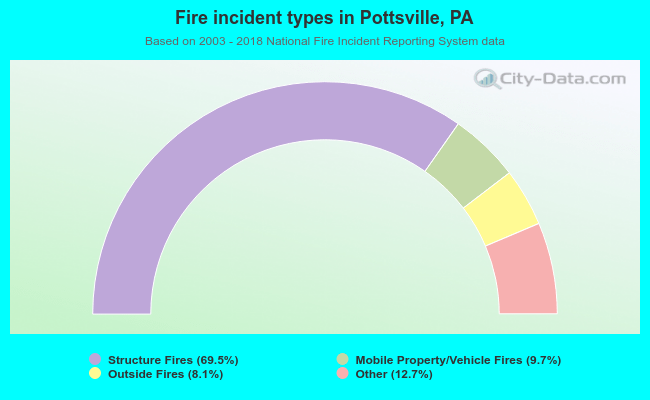 When looking into fire subcategories, the most reports belonged to: Structure Fires (69.5%), and Other (12.7%).