Powell: Fire Incidents, Wyoming (WY)
Where are fire incidents reported in Powell, WY
Something went wrong! Please refresh the page.
|
| |||||||||||||||||||||||||||||||||||||||||||||||||||||||||||||||||||||||||||||||||||||||||||||||||||||||||||||
2002 - 2018 National Fire Incident Reporting System (NFIRS) incidents
- Incident types reported to NFIRS in Powell, WY
- 68747.7%Fire
- 29120.2%False Alarm
- 26418.3%Rescue & EMS
- 1369.4%Hazardous Condition
- 473.3%Good Intent Call
- 151.0%Service Call
- Fire incident types reported to NFIRS in Powell, WY
- 30945.0%Outside Fires
- 16023.3%Structure Fires
- 14421.0%Other
- 7410.8%Mobile Property/Vehicle Fires
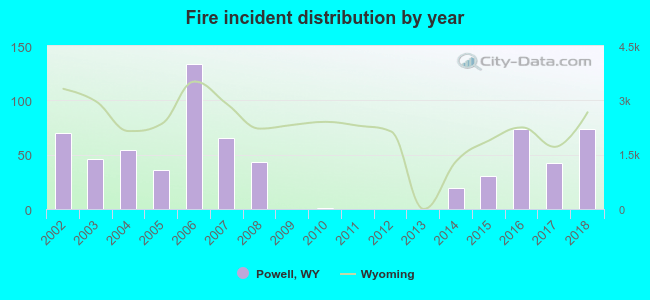 According to the data from the years 2002 - 2018 the average number of fires per year is 40. The highest number of reported fires - 133 took place in 2006, and the least - 0 in 2009. The data has an increasing trend.
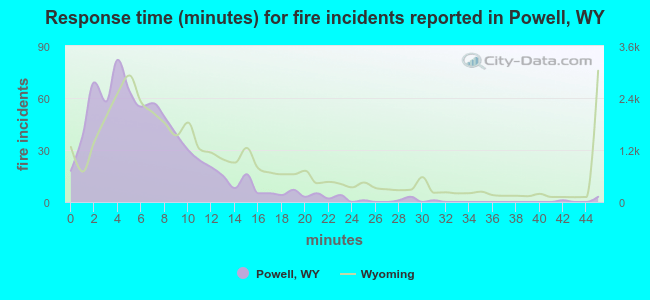 The median response time based on all reported fire incidents is 6 minutes. This is lower than the state median value.
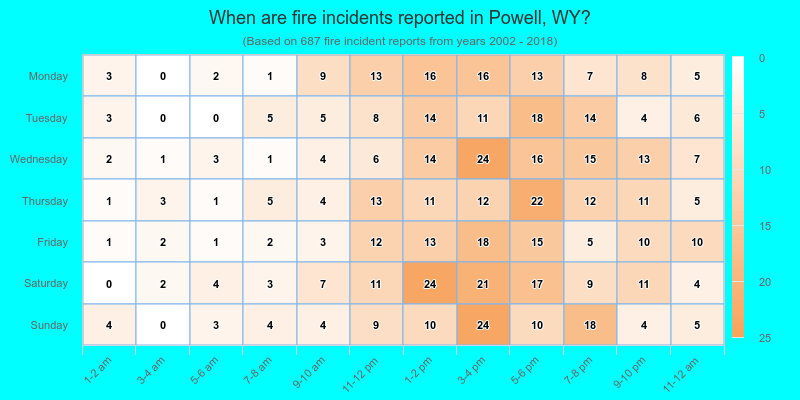
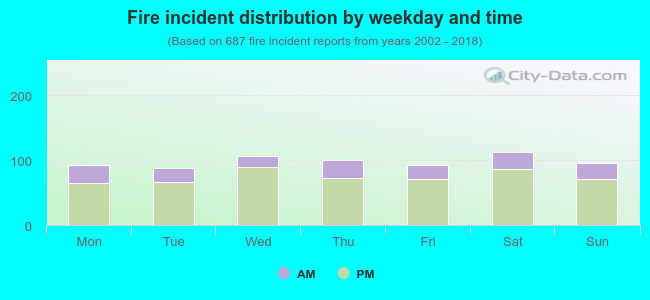 24.0% incidents where reported in the morning and 76.0% in the evening. The most fires (16.4%) took place on Saturday, and the least (12.8%) on Tuesday.
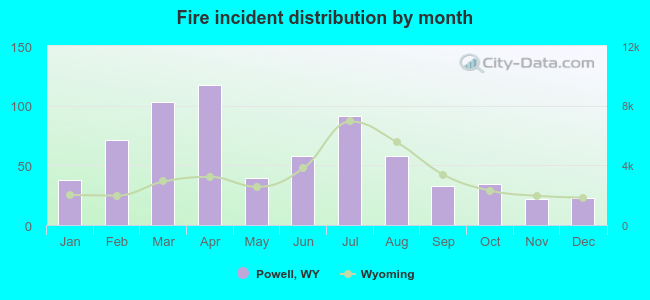 According to the 687 fire incidents from years 2002 - 2018 most fires (17.0%) took place during April, and the least (3.2%) in November.
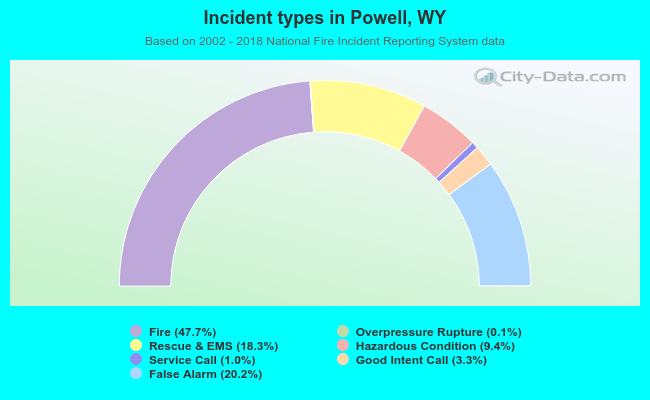 Out of all 1,441 cases reported during the years 2002 - 2018, the most belonged to the categories: Fire (47.7%), False Alarm (20.2%), and Rescue & EMS (18.3%).
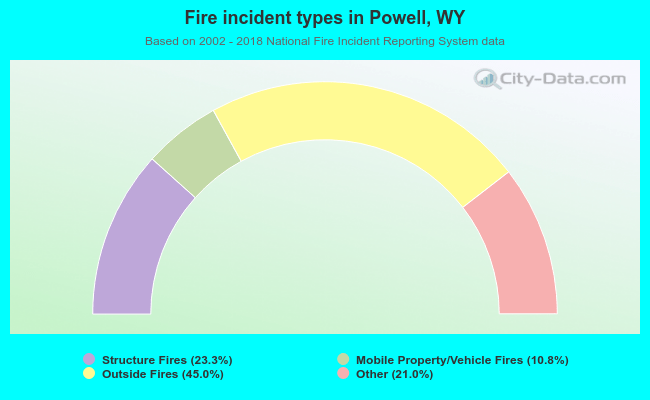 When looking into fire subcategories, the most incidents belonged to: Outside Fires (45.0%), and Structure Fires (23.3%).