Prairieville: Fire Incidents, Louisiana (LA)
Where are fire incidents reported in Prairieville, LA
Something went wrong! Please refresh the page.
| Fire incidents reported | |
|---|---|
| Sreet name | Count |
| HWY 42 HWY | 176 |
| AIRLINE HWY | 152 |
| US 61 | 72 |
| LA 73 | 62 |
| HWY 44 HWY | 56 |
| MOODY DIXON RD | 56 |
| INTERSTATE I10 | 54 |
| HWY 42 | 42 |
| HWY 933 HWY | 42 |
| INTERSTATE I-10 | 42 |
| AIRLINE HWY | 40 |
| HWY 933 | 40 |
| LA. 73 | 40 |
| HWY 431 HWY | 34 |
| LA 621 | 34 |
| LA. 42 | 32 |
| ROY ROGERS RD | 32 |
| HWY 931 HWY | 30 |
| LA 42 | 30 |
| OAK MEADOW RD | 28 |
| HWY 73 | 26 |
| I-10 | 26 |
| LITTLE PRAIRIE RD | 26 |
| SWAMP RD | 26 |
| WHITE RD | 26 |
| BRAUD RD | 24 |
| GERMANY RD | 24 |
| HWY 621 | 24 |
| JOE SEVARIO | 24 |
| MUDDY CREEK RD | 24 |
| Other | 949 |
2002 - 2018 National Fire Incident Reporting System (NFIRS) incidents
- Incident types reported to NFIRS in Prairieville, LA
- 9,00455.2%Rescue & EMS
- 2,53515.5%Good Intent Call
- 2,29314.1%Fire
- 1,2087.4%False Alarm
- 6233.8%Service Call
- 6193.8%Hazardous Condition
- Fire incident types reported to NFIRS in Prairieville, LA
- 1,09247.6%Outside Fires
- 69730.4%Structure Fires
- 34915.2%Mobile Property/Vehicle Fires
- 1556.8%Other
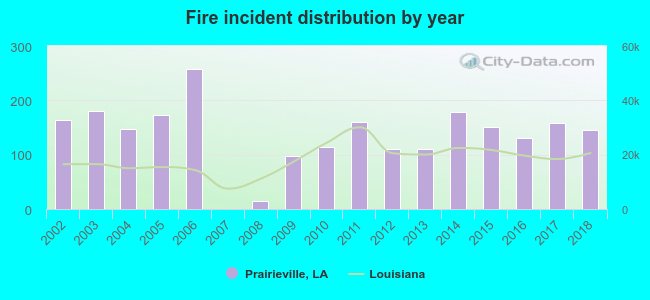 According to the data from the years 2002 - 2018 the average number of fire incidents per year is 135. The highest number of reported fires - 257 took place in 2006, and the least - 0 in 2007. The data has a dropping trend.
The average number of yearly fire incidents per 10k residents in Prairieville, LA compared to nearest cities:
(Note: Based on data for the last 3 years, including only cities with population 5,000 and above)
| Prairieville: | 53.8 |
| Gonzales: | 132.3 |
| Denham Springs: | 383.0 |
| Monticello: | 1.9 |
| Donaldsonville: | 74.7 |
| Walker: | 191.8 |
| Baton Rouge: | 60.1 |
| Plaquemine: | 100.1 |
| Port Allen: | 77.8 |
 The median response time based on all reported fire incidents is 6 minutes. This is comparable to the state median value.
The median response time in Prairieville, LA compared to nearest cities:
(Note: Based on data for all years, including only cities with at least 500 fire incidents)
| Prairieville: | 6 minutes |
| Gonzales: | 6 minutes |
| Denham Springs: | 7 minutes |
| Donaldsonville: | 4 minutes |
| Walker: | 8 minutes |
| Baton Rouge: | 4 minutes |
| Plaquemine: | 5 minutes |
| Port Allen: | 5 minutes |
| Livingston: | 9 minutes |
 According to the reports from the years 2002 - 2018 the average number of fire-related yearly deaths is 0. The highest number of reported deaths - 1 took place in 2002, and the lowest - 0 in 2003. The data has a constant trend.
 According to the reports from the years 2002 - 2018 the average number of fire-related casualties per year is 0. The highest number of reported injuries - 2 took place in 2011, and the lowest - 0 in 2003. The data has a decreasing trend.
The average number of injuries per 1,000 fire incidents is 3. This indicator was the highest - 12 in 2011, and the lowest 0 in 2003. The trend for injuries per 1,000 fires is decreasing. Compared to the Louisiana value the number of injuries per 1,000 incidents is lower.
According to the reports from the years 2002 - 2018 the average number of fire-related casualties per year is 0. The highest number of reported injuries - 2 took place in 2011, and the lowest - 0 in 2003. The data has a decreasing trend.
The average number of injuries per 1,000 fire incidents is 3. This indicator was the highest - 12 in 2011, and the lowest 0 in 2003. The trend for injuries per 1,000 fires is decreasing. Compared to the Louisiana value the number of injuries per 1,000 incidents is lower.Casualties per 1,000 incidents in Prairieville, LA compared to nearest cities:
(Note: Based on data for all years, including only cities with at least 500 fire incidents)
| Prairieville: | 3.1 |
| Gonzales: | 2.3 |
| Denham Springs: | 15.1 |
| Donaldsonville: | 6.5 |
| Walker: | 6.4 |
| Baton Rouge: | 6.4 |
| Plaquemine: | 3.0 |
| Port Allen: | 21.7 |
| Livingston: | 1.5 |
 26.7% incidents where reported in the morning and 73.3% in the evening. The most fires (15.2%) took place on Saturday, and the least (13.3%) on Thursday.
 Based on the 2,293 fires from years 2002 - 2018 most fires (13.3%) took place during January, and the least (6.2%) in November.
 Out of all 16,318 cases reported during the years 2002 - 2018, the most belonged to the categories: Rescue & EMS (55.2%), Good Intent Call (15.5%), and Fire (14.1%).
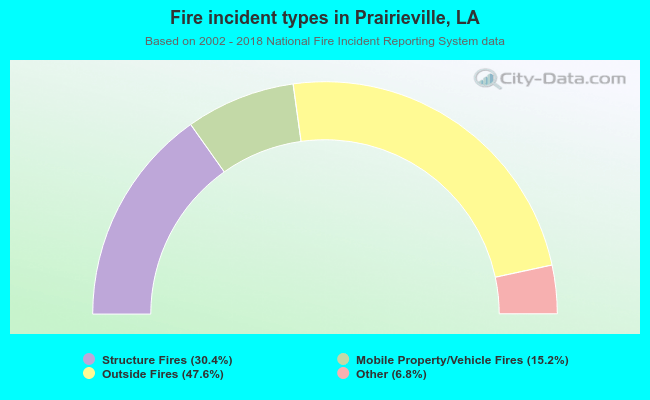 When looking into fire subcategories, the most reports belonged to: Outside Fires (47.6%), and Structure Fires (30.4%).