Preston: Fire Incidents, Idaho (ID)
Where are fire incidents reported in Preston, ID
Something went wrong! Please refresh the page.
|
| |||||||||||||||||||||||||||||||||||||||||||||||||||||||||||||||||||||||||||||||||||||||||||||||||||||||||||||
2003 - 2018 National Fire Incident Reporting System (NFIRS) incidents
- Incident types reported to NFIRS in Preston, ID
- 47944.6%Fire
- 34432.0%Hazardous Condition
- 767.1%Good Intent Call
- 726.7%Rescue & EMS
- 534.9%False Alarm
- 484.5%Service Call
- 20.2%Special Incident
- Fire incident types reported to NFIRS in Preston, ID
- 23348.6%Outside Fires
- 15933.2%Structure Fires
- 8116.9%Mobile Property/Vehicle Fires
- 61.3%Other
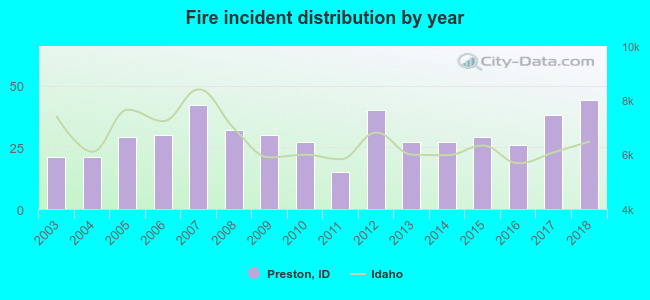 Based on the data from the years 2003 - 2018 the average number of fires per year is 30. The highest number of fire incidents - 44 took place in 2018, and the least - 15 in 2011. The data has a growing trend.
The average number of yearly fire incidents per 10k residents in Preston, ID compared to nearest cities:
(Note: Based on data for the last 3 years, including only cities with population 5,000 and above)
| Preston: | 69.0 |

 Based on the reports from the years 2003 - 2018 the average number of fire-related casualties per year is 1. The highest number of reported casualties - 4 took place in 2011, and the lowest - 0 in 2007. The data has a dropping trend.
 23.8% incidents where reported in the morning and 76.2% in the evening. The most fires (17.5%) took place on Wednesday, and the least (11.7%) on Friday.
 According to the 479 fire incident reports from years 2003 - 2018 most fires (16.7%) took place during July, and the least (4.8%) in January.
 Out of all 1,075 cases reported during the years 2003 - 2018, the most belonged to the categories: Fire (44.6%), Hazardous Condition (32.0%), and Good Intent Call (7.1%).
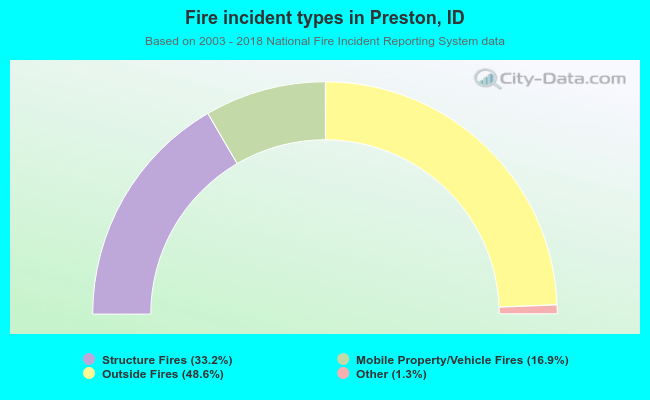 When looking into fire subcategories, the most incidents belonged to: Outside Fires (48.6%), and Structure Fires (33.2%).