| Fire incidents reported |
|---|
| Sreet name | Count |
|---|
| ARMSTRONG RD | 20 | | BROWN RD | 12 | | FORD RD | 12 | | CHIDSEY HILL RD | 8 | | COUNTY ROUTE 78 | 8 | | COUNTY ROUTE 74 | 6 | | COUNTY ROUTE 77 | 6 | | STATE ROUTE 54A | 6 | | STONE RD | 6 | | 8324 COUNTY ROUTE 77 | 4 | | ARMSTRONG RD | 4 | | BROWN RD | 4 | | COUNTY ROUTE 75 | 4 | | CROSS ST | 4 | | GALLAGHER RD | 4 | | GLOADES CORNERS RD | 4 | | STATE ROUTE 53 | 4 | | TOWN LINE RD | 4 | | WEST LAKE RD | 4 | | 10066 COUNTY ROUTE 76 | 2 | | 10304 COUNTY ROUTE 76 | 2 | | 10442 COUNTY ROUTE 76 | 2 | | 10785 KIPP LANE | 2 | | 10829 MILL STREET | 2 | | 11230 GLOADES CORNERS RD | 2 |
| | | Fire incidents reported |
|---|
| Sreet name | Count |
|---|
| 11528 THORNAPPLE HILL ROAD | 2 | | 12194A WEST LAKE ROAD | 2 | | 12388 W LAKE RD | 2 | | 12646 ROUTE 54A | 2 | | 13275 WEST LAKE ROAD | 2 | | 14126 WEST LAKE RD | 2 | | 14157 WEST LAKE ROAD | 2 | | 14468 W LAKE RD RD | 2 | | 145 | 2 | | 16032 W LAKE RD | 2 | | 1GALLAGHER RD | 2 | | 2898 STATE ROUTE 54 | 2 | | 54A HWY | 2 | | 7380 FISH HATCHERY ROAD | 2 | | 7983 BRIGLIN RD | 2 | | 8149 BRIGLIN RD | 2 | | 8257 COUNTY ROUTE 75 | 2 | | 8401 STONE ROAD | 2 | | 8614 COUNTY ROUTE 77 | 2 | | 8994 ARMSTRONG RD | 2 | | 9069 ROFF HILL RD | 2 | | BEAN STATION RD | 2 | | BEAN STATION RD. | 2 | | BRANCHPORT FIRE HOUSE | 2 | | |
|
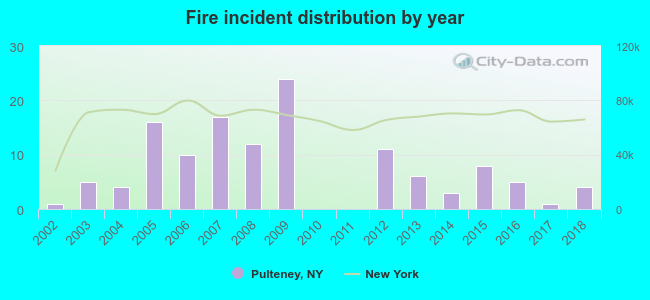 Based on the data from the years 2002 - 2018 the average number of fire incidents per year is 7. The highest number of fire incidents - 24 took place in 2009, and the least - 0 in 2010. The data has a growing trend.
 29.1% incidents where reported in the morning and 70.9% in the evening. The most fires (22.8%) took place on Sunday, and the least (9.4%) on Friday.
 According to the 127 reports from years 2002 - 2018 most fires (15.7%) took place during April, and the least (3.1%) in January.
 Out of all 308 cases reported during the years 2002 - 2018, the most belonged to the categories: Fire (41.2%), Rescue & EMS (25.3%), and Overpressure Rupture (12.7%).
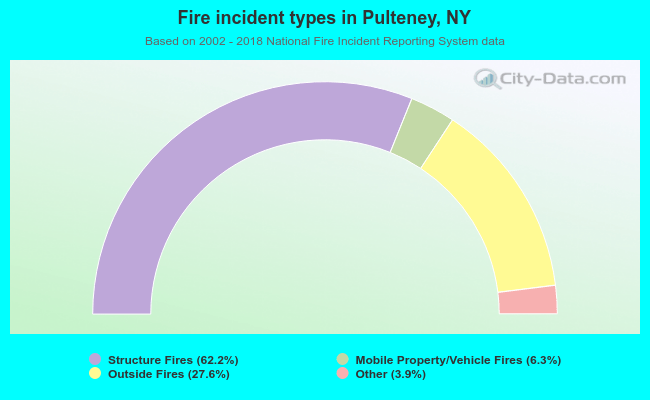 When looking into fire subcategories, the most incidents belonged to: Structure Fires (62.2%), and Outside Fires (27.6%).