| Fire incidents reported |
|---|
| Sreet name | Count |
|---|
| COOL RUN RD | 20 | | GRAVELLY HILL RD | 18 | | QUINTON MARLBORO RD | 16 | | TELEGRAPH RD | 14 | | GRAVELY HILL RD | 12 | | JERICHO RD | 12 | | RT 49 | 12 | | CROSS RD | 10 | | SALEM QUINTON RD | 10 | | WATERWORKS RD | 10 | | MAIN ST | 8 | | BURDEN HILL RD | 6 | | EAST AVE | 6 | | QUINTON ALLOWAY RD | 6 | | COHANSEY RD | 4 | | COHANSEY-PECKS CORNER RD | 4 | | NEW BRIDGE RD | 4 | | PECKS CORNER COHANSEY RD | 4 | | PECKS CORNER-COHANSEY RD | 4 | | QUINTON-ALLOWAY (QUINTON) RD | 4 | | SIMS DR | 4 | | WATERWORKS | 4 | | ACTON STATION RD | 2 | | ALLOWAY FRIESBURG RD | 2 | | BEASLEY NECK RD | 2 |
| | | Fire incidents reported |
|---|
| Sreet name | Count |
|---|
| BROWN RD | 2 | | CLANCY RD | 2 | | COOL RUN RD | 2 | | GLASSHOUSE LN | 2 | | GRAVELLY HILL | 2 | | GRAVELLY HILL ROAD RD | 2 | | GRIEVES PKY | 2 | | HARMERSVILLE PECKS CORNER RD | 2 | | HARMERSVILLE PECKS CORNER RD | 2 | | HILES AVE | 2 | | HOWARD AVE | 2 | | LAWRENCE RD | 2 | | MAIN | 2 | | MAIN (13) ST | 2 | | MAIN (RT. 49) ST | 2 | | MIAN ST | 2 | | MICKELS MILL RD | 2 | | N. BURDEN HILL RD | 2 | | PECKS CORNER RD | 2 | | PECKS CORNER- COHANSEY RD | 2 | | QUINTON HANCOCKS RD | 2 | | QUINTON MARLBORO RD | 2 | | QUINTONHANCOCKS RD | 2 | | QUINTONMARLBORO RD | 2 | | ROBINSON ST | 2 |
|
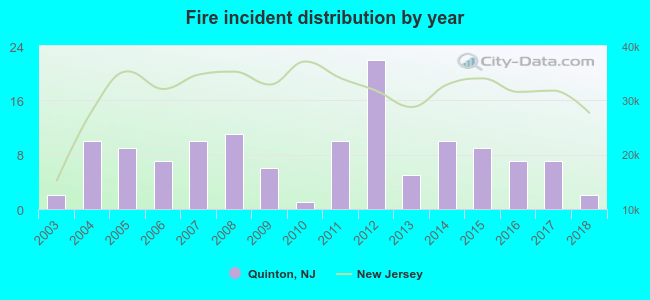 According to the data from the years 2003 - 2018 the average number of fires per year is 8. The highest number of fire incidents - 22 took place in 2012, and the least - 1 in 2010. The data has a constant trend.
 According to the data from the years 2003 - 2018 the average number of fire-related casualties per year is 0. The highest number of casualties - 3 took place in 2017, and the lowest - 0 in 2003. The data has a constant trend.
 28.1% incidents where reported in the morning and 71.9% in the evening. The most fires (25.0%) took place on Monday, and the least (7.0%) on Thursday.
 Based on the 128 incident reports from years 2003 - 2018 most fires (15.6%) took place during November, and the least (1.6%) in May.
 Out of all 311 cases reported during the years 2003 - 2018, the most belonged to the categories: Fire (41.2%), Rescue & EMS (29.6%), and Hazardous Condition (12.9%).
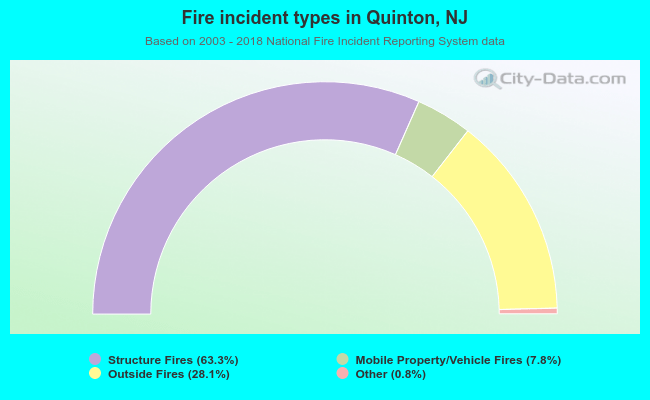 When looking into fire subcategories, the most reports belonged to: Structure Fires (63.3%), and Outside Fires (28.1%).