Rainsville: Fire Incidents, Alabama (AL)
Where are fire incidents reported in Rainsville, AL
Something went wrong! Please refresh the page.
|
| |||||||||||||||||||||||||||||||||||||||||||||||||||||||||||||||||||||||||||||||||||||||||||||||||||||||||||||
2006 - 2018 National Fire Incident Reporting System (NFIRS) incidents
- Incident types reported to NFIRS in Rainsville, AL
- 1,97566.6%Rescue & EMS
- 35111.8%Fire
- 2859.6%Service Call
- 2107.1%Good Intent Call
- 662.2%Hazardous Condition
- 652.2%False Alarm
- 80.3%Severe Weather
- 30.1%Overpressure Rupture
- 30.1%Special Incident
- Fire incident types reported to NFIRS in Rainsville, AL
- 16747.6%Outside Fires
- 12234.8%Structure Fires
- 4512.8%Mobile Property/Vehicle Fires
- 174.8%Other
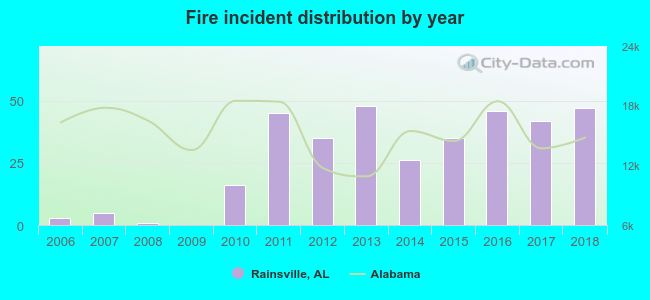 According to the data from the years 2006 - 2018 the average number of fire incidents per year is 27. The highest number of reported fires - 48 took place in 2013, and the least - 0 in 2009. The data has a growing trend.
The average number of yearly fire incidents per 10k residents in Rainsville, AL compared to nearest cities:
(Note: Based on data for the last 3 years, including only cities with population 5,000 and above)
| Rainsville: | 89.8 |
| Fort Payne: | 42.0 |
| Scottsboro: | 64.4 |
| Albertville: | 115.0 |
| Boaz: | 86.4 |
| Guntersville: | 119.2 |
| Gadsden: | 58.5 |
| Attalla: | 42.6 |
| Glencoe: | 85.7 |

 30.8% incidents where reported in the morning and 69.2% in the evening. The most fires (20.8%) took place on Friday, and the least (8.3%) on Tuesday.
 According to the 351 reports from years 2006 - 2018 most fires (10.5%) took place during October, and the least (6.8%) in May.
 Out of all 2,966 cases reported during the years 2006 - 2018, the most belonged to the categories: Rescue & EMS (66.6%), Fire (11.8%), and Service Call (9.6%).
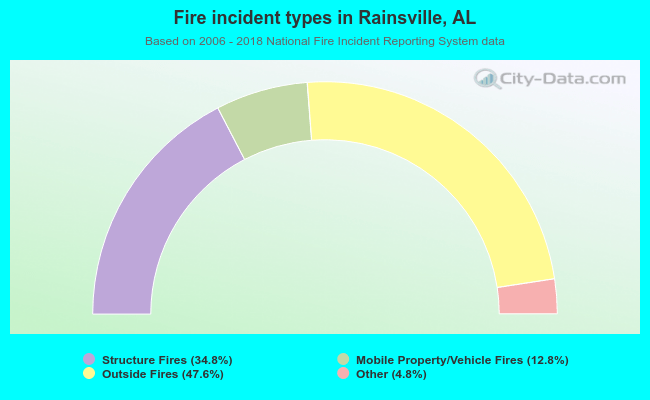 When looking into fire subcategories, the most reports belonged to: Outside Fires (47.6%), and Structure Fires (34.8%).