Rankin: Fire Incidents, Pennsylvania (PA)
Where are fire incidents reported in Rankin, PA
Something went wrong! Please refresh the page.
|
| |||||||||||||||||||||||||||||||||||||||||||||||||||||||||||||||||||||||||||||||||||||||||||||||||||||||||||||
2004 - 2018 National Fire Incident Reporting System (NFIRS) incidents
- Incident types reported to NFIRS in Rankin, PA
- 19025.4%Hazardous Condition
- 16421.9%False Alarm
- 16021.4%Fire
- 12316.4%Good Intent Call
- 608.0%Service Call
- 456.0%Rescue & EMS
- 40.5%Special Incident
- 30.4%Severe Weather
- Fire incident types reported to NFIRS in Rankin, PA
- 12980.6%Structure Fires
- 148.8%Other
- 106.3%Outside Fires
- 74.4%Mobile Property/Vehicle Fires
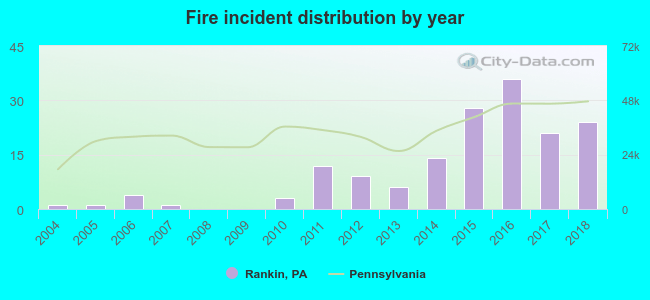 According to the data from the years 2004 - 2018 the average number of fires per year is 11. The highest number of reported fires - 36 took place in 2016, and the least - 0 in 2008. The data has an increasing trend.
 31.3% incidents where reported in the morning and 68.8% in the evening. The most fires (17.5%) took place on Tuesday, and the least (13.1%) on Monday.
 According to the 160 fire incidents from years 2004 - 2018 most fires (14.4%) took place during March, and the least (1.3%) in October.
 Out of all 749 cases reported during the years 2004 - 2018, the most belonged to the categories: Rescue & EMS (25.4%), Good Intent Call (21.9%), and Fire (21.4%).
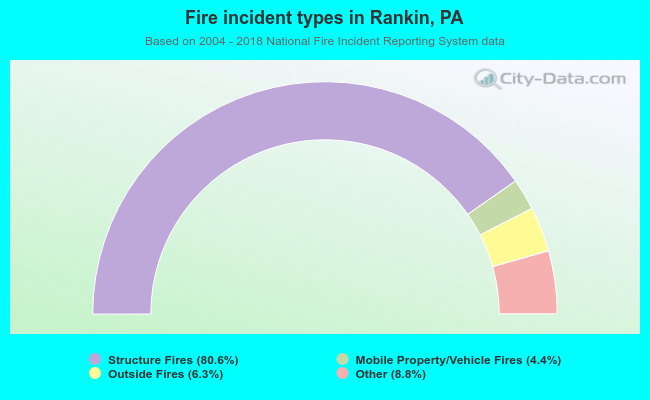 When looking into fire subcategories, the most reports belonged to: Structure Fires (80.6%), and Other (8.8%).