| Fire incidents reported |
|---|
| Sreet name | Count |
|---|
| HWY 1 | 8 | | N OF RAVIA ON HWY 1 | 8 | | DAUBE RANCH RD | 6 | | MCSWAIN LANE | 6 | | COBB RD LGTS | 4 | | DOVE RD. | 4 | | GRAND | 4 | | HWY 1 3 MILES N. | 4 | | MILL ST LGTS | 4 | | PINE CREEK RD | 4 | | WEST OF BROKEN SLAB/ROCK CREEK | 4 | | 1 MILE S. OF SH1 ON MILL STR. | 2 | | 100 SOUTH COLLEGE ST | 2 | | 10005 S MILL ST LGTS | 2 | | 101 S COLLEGE | 2 | | 10115 S. MILL ST. | 2 | | 102 S 4TH LGTS | 2 | | 107 N MILL ST | 2 | | 107 S MILL ST | 2 | | 109 2ND AVE ST | 2 | | 2 MILES W. ON GREASY BEND RD | 2 | | 200 EAST 1 AVE | 2 | | 201 W GRAND | 2 | | 202 S 2ND | 2 | | 202 SOUTH 3RD | 2 |
| | | Fire incidents reported |
|---|
| Sreet name | Count |
|---|
| 22 | 2 | | 2ND | 2 | | 2ND 6TH AVE | 2 | | 2ND AVE | 2 | | 2ND ST | 2 | | 2ND ST LGTS | 2 | | 2ND. ST. & 2ND. AVE. | 2 | | 2ND. ST. & WASHINGTON | 2 | | 3 M N. RAVIA SH1 | 2 | | 302 EAST GRAND | 2 | | 3280 HWY 1 SOUTH | 2 | | 3RD STREET | 2 | | 408 W OXLEY | 2 | | 408 W. OXLEY | 2 | | 502 WEST GRAND | 2 | | 508 SOUTH COLLEGE ST | 2 | | 5407 OK HWY 1 | 2 | | 6301 WEST LAKESESTATE | 2 | | 635 NORTH REDMAN RD | 2 | | 6870 WRECKER RD | 2 | | 6TH AVE | 2 | | 6TH AVE | 2 | | 6TH STREET | 2 | | 7700 ROCKY CREEK ROAD | 2 | | |
|
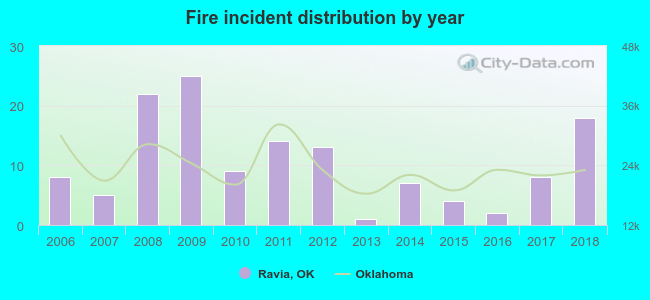 Based on the data from the years 2006 - 2018 the average number of fires per year is 10. The highest number of reported fires - 25 took place in 2009, and the least - 1 in 2013. The data has a rising trend.
 22.8% incidents where reported in the morning and 77.2% in the evening. The most fires (19.1%) took place on Friday, and the least (10.3%) on Monday.
 According to the 136 fire incidents from years 2006 - 2018 most fires (18.4%) took place during July, and the least (2.2%) in June.
 Out of all 527 cases reported during the years 2006 - 2018, the most belonged to the categories: Rescue & EMS (61.9%), Fire (25.8%), and Hazardous Condition (4.0%).
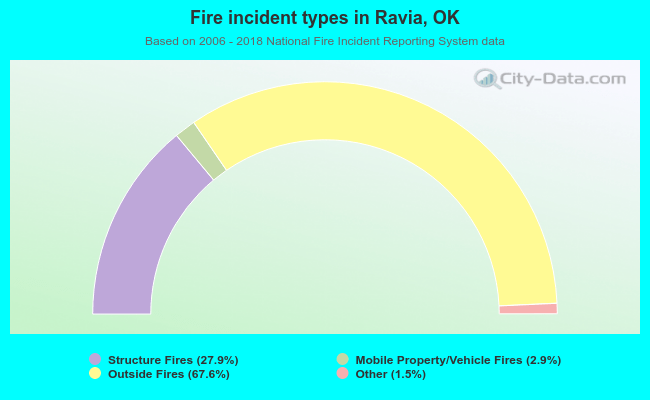 When looking into fire subcategories, the most incidents belonged to: Outside Fires (67.6%), and Structure Fires (27.9%).