| Fire incidents reported |
|---|
| Sreet name | Count |
|---|
| COUNTY 17 RD | 28 | | COUNTY ROAD 15 | 26 | | COUNTY HWY 15 | 20 | | COUNTY ROAD 16 | 18 | | MAIN ST | 18 | | COUNTY HWY 17 WELLS TWP | 16 | | COUNTY ROAD 17 | 16 | | TOWNSHIP 156 RD | 16 | | COUNTY ROAD 3 | 14 | | TOWNSHIP 157 RD | 14 | | COUNTY 17 | 12 | | COUNTY ROAD 1 | 12 | | CTY RD 17 | 12 | | NARROWS RD | 12 | | STATE ROUTE 151 | 12 | | CHURCH ST | 10 | | COUNTY 15 RD | 10 | | COUNTY 18 RD | 10 | | COUNTY HWY 16 | 10 | | CTY. RD 15 | 10 | | TOWNSHIP ROAD 15 | 10 | | COUNTY HWY 17 WARREN TWP | 8 | | CTY. RD 14 | 8 | | CTY. RD 16 | 8 | | CTY. RD 17 | 8 |
| | | Fire incidents reported |
|---|
| Sreet name | Count |
|---|
| GRANDVIEW AVE | 8 | | JONES RD | 8 | | MAIN STREET | 8 | | STATE HWY 150 | 8 | | CO RD 17 ST | 6 | | COUNTY HWY 1 | 6 | | COUNTY HWY 14 | 6 | | JONES ROAD | 6 | | OLD STATE HWY 7 | 6 | | OLD STATE ROUTE 7 | 6 | | STATE HWY 7 | 6 | | TOWNSHIP 163 RD | 6 | | TOWNSHIP HWY 156 | 6 | | TWP RD 156 | 6 | | COUNTY 2 RD | 4 | | COUNTY HWY 2 | 4 | | COUNTY ROAD 14 | 4 | | COUNTY ROAD 15 RD | 4 | | CTY RD 15 | 4 | | CTY RD 2 RD | 4 | | CTY. RD 1 | 4 | | LIBERTY ST | 4 | | LITTLE RUSH RUN RD | 4 | | MARKET STREET ST | 4 | | |
|
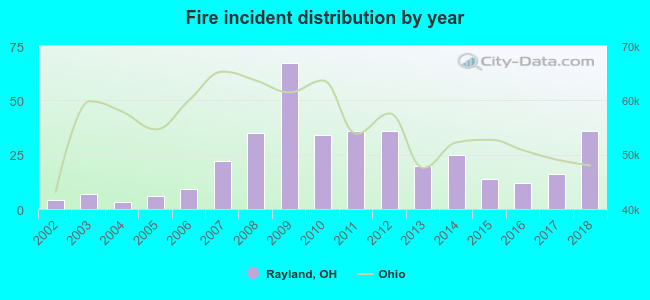 Based on the data from the years 2002 - 2018 the average number of fires per year is 22. The highest number of reported fires - 67 took place in 2009, and the least - 3 in 2004. The data has a growing trend.
 34.3% incidents where reported in the morning and 65.7% in the evening. The most fires (20.2%) took place on Sunday, and the least (8.6%) on Wednesday.
 Based on the 382 incident reports from years 2002 - 2018 most fires (20.4%) took place during March, and the least (1.6%) in December.
 Out of all 1,302 cases reported during the years 2002 - 2018, the most belonged to the categories: Overpressure Rupture (40.3%), Fire (29.3%), and Hazardous Condition (17.8%).
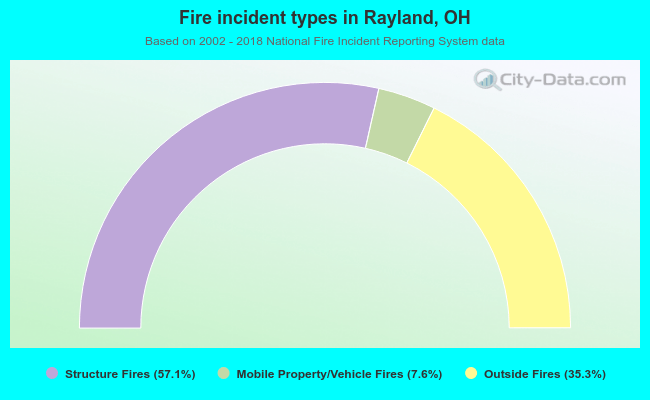 When looking into fire subcategories, the most incidents belonged to: Structure Fires (57.1%), and Outside Fires (35.3%).