Reading: Fire Incidents, Kansas (KS)
Where are fire incidents reported in Reading, KS
Something went wrong! Please refresh the page.
|
| |||||||||||||||||||||||||||||||||||||||||||||||||||||||||||||||||||||||||||||||||||||||||||||||||||||||||||||
| Other | 21 | |||||||||||||||||||||||||||||||||||||||||||||||||||||||||||||||||||||||||||||||||||||||||||||||||||||||||||||
2002 - 2018 National Fire Incident Reporting System (NFIRS) incidents
- Incident types reported to NFIRS in Reading, KS
- 30159.7%Fire
- 11322.4%Rescue & EMS
- 7114.1%Good Intent Call
- 173.4%Hazardous Condition
- 10.2%Severe Weather
- 10.2%Special Incident
- Fire incident types reported to NFIRS in Reading, KS
- 23277.1%Outside Fires
- 4013.3%Structure Fires
- 268.6%Mobile Property/Vehicle Fires
- 31.0%Other
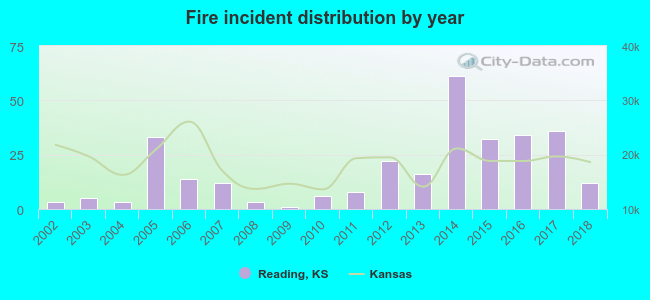 Based on the data from the years 2002 - 2018 the average number of fire incidents per year is 18. The highest number of fire incidents - 61 took place in 2014, and the least - 1 in 2009. The data has an increasing trend.
 19.3% incidents where reported in the morning and 80.7% in the evening. The most fires (16.9%) took place on Friday, and the least (9.6%) on Thursday.
 Based on the 301 reports from years 2002 - 2018 most fires (26.2%) took place during March, and the least (1.3%) in June.
 Out of all 504 cases reported during the years 2002 - 2018, the most belonged to the categories: Fire (59.7%), Overpressure Rupture (22.4%), and Hazardous Condition (14.1%).
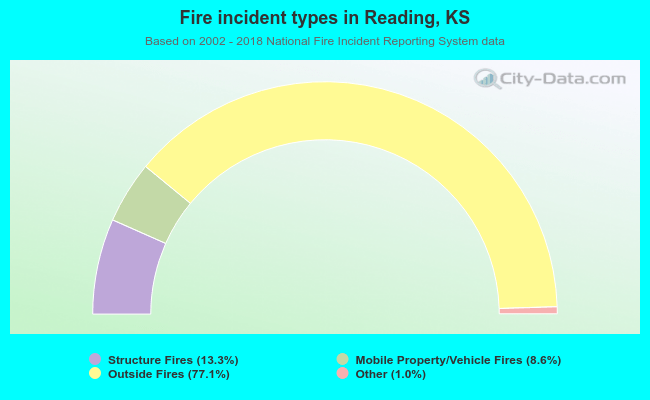 When looking into fire subcategories, the most incidents belonged to: Outside Fires (77.1%), and Structure Fires (13.3%).