Red Springs: Fire Incidents, North Carolina (NC)
Where are fire incidents reported in Red Springs, NC
Something went wrong! Please refresh the page.
|
| |||||||||||||||||||||||||||||||||||||||||||||||||||||||||||||||||||||||||||||||||||||||||||||||||||||||||||||
| Other | 46 | |||||||||||||||||||||||||||||||||||||||||||||||||||||||||||||||||||||||||||||||||||||||||||||||||||||||||||||
2002 - 2018 National Fire Incident Reporting System (NFIRS) incidents
- Incident types reported to NFIRS in Red Springs, NC
- 2,30862.4%Fire
- 43011.6%Rescue & EMS
- 3659.9%Hazardous Condition
- 2697.3%False Alarm
- 2025.5%Good Intent Call
- 1103.0%Service Call
- 110.3%Special Incident
- Fire incident types reported to NFIRS in Red Springs, NC
- 1,28855.8%Outside Fires
- 84536.6%Structure Fires
- 1265.5%Mobile Property/Vehicle Fires
- 492.1%Other
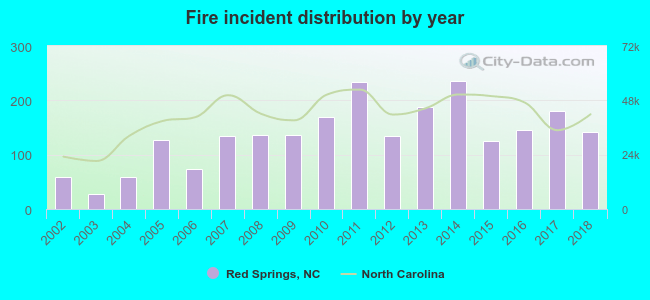 Based on the data from the years 2002 - 2018 the average number of fires per year is 136. The highest number of reported fires - 236 took place in 2014, and the least - 27 in 2003. The data has an increasing trend.
 The median response time based on all reported fire incidents is 9 minutes. This is higher than the North Carolina median value.
The median response time in Red Springs, NC compared to nearest cities:
(Note: Based on data for all years, including only cities with at least 500 fire incidents)
| Red Springs: | 9 minutes |
| Shannon: | 10 minutes |
| Lumber Bridge: | 10 minutes |
| Pembroke: | 11 minutes |
| Maxton: | 12 minutes |
| Parkton: | 9 minutes |
| Raeford: | 8 minutes |
| Lumberton: | 7 minutes |
| Laurinburg: | 5 minutes |
 Based on the data from the years 2002 - 2018 the average number of fire-related yearly deaths is 0. The highest number of deaths - 2 took place in 2003, and the lowest - 0 in 2002. The data has a constant trend.
 30.1% incidents where reported in the morning and 69.9% in the evening. The most fires (16.9%) took place on Saturday, and the least (12.6%) on Sunday.
 Based on the 2,308 fire incidents from years 2002 - 2018 most fires (13.3%) took place during March, and the least (5.4%) in June.
 Out of all 3,699 cases reported during the years 2002 - 2018, the most belonged to the categories: Fire (62.4%), Rescue & EMS (11.6%), and Hazardous Condition (9.9%).
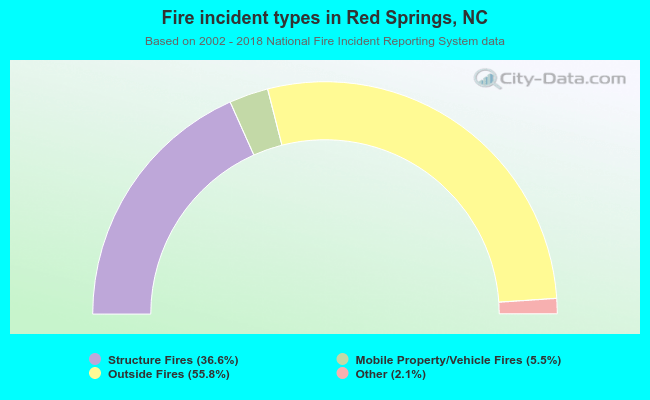 When looking into fire subcategories, the most incidents belonged to: Outside Fires (55.8%), and Structure Fires (36.6%).