Redwater: Fire Incidents, Texas (TX)
Where are fire incidents reported in Redwater, TX
Something went wrong! Please refresh the page.
|
| |||||||||||||||||||||||||||||||||||||||||||||||||||||||||||||||||||||||||||||||||||||||||||||||||||||||||||||
2002 - 2018 National Fire Incident Reporting System (NFIRS) incidents
- Incident types reported to NFIRS in Redwater, TX
- 35171.6%Fire
- 5110.4%Hazardous Condition
- 479.6%Rescue & EMS
- 214.3%Good Intent Call
- 122.4%Service Call
- 61.2%False Alarm
- 20.4%Special Incident
- Fire incident types reported to NFIRS in Redwater, TX
- 20257.5%Outside Fires
- 10730.5%Structure Fires
- 246.8%Mobile Property/Vehicle Fires
- 185.1%Other
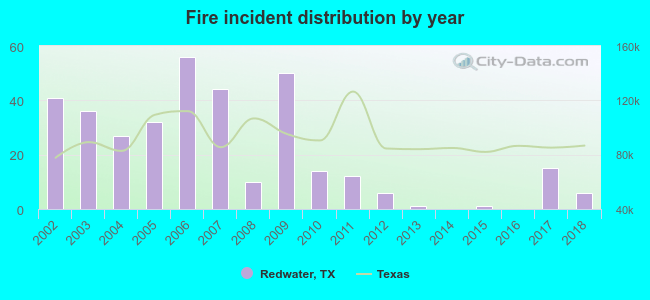 According to the data from the years 2002 - 2018 the average number of fires per year is 21. The highest number of reported fires - 56 took place in 2006, and the least - 0 in 2014. The data has a declining trend.
 26.2% incidents where reported in the morning and 73.8% in the evening. The most fires (17.4%) took place on Sunday, and the least (12.0%) on Wednesday.
 Based on the 351 reports from years 2002 - 2018 most fires (14.2%) took place during January, and the least (4.3%) in June.
 Out of all 490 cases reported during the years 2002 - 2018, the most belonged to the categories: Fire (71.6%), Rescue & EMS (10.4%), and Overpressure Rupture (9.6%).
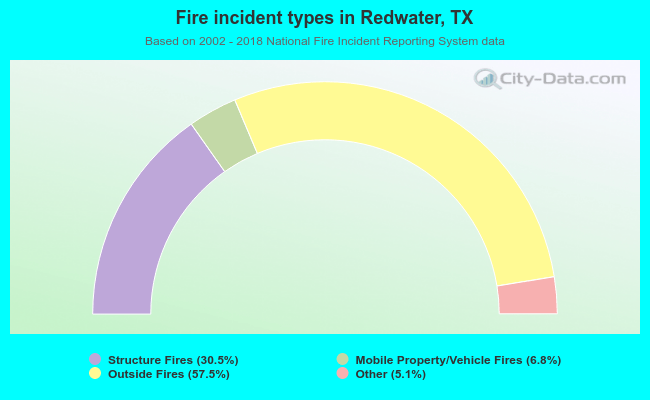 When looking into fire subcategories, the most reports belonged to: Outside Fires (57.5%), and Structure Fires (30.5%).