Redwood City: Fire Incidents, California (CA)
Where are fire incidents reported in Redwood City, CA
Something went wrong! Please refresh the page.
| Fire incidents reported | |
|---|---|
| Sreet name | Count |
| EL CAMINO REAL | 168 |
| BROADWAY ST | 138 |
| MIDDLEFIELD RD | 130 |
| WOODSIDE RD | 126 |
| 101 | 96 |
| BAYSHORE RD | 80 |
| VETERANS BLVD | 74 |
| SPRING ST | 64 |
| MARSHALL ST | 58 |
| ROLISON RD | 58 |
| HUDSON ST | 54 |
| CHESTNUT ST | 52 |
| MAPLE ST | 52 |
| ROOSEVELT AV | 48 |
| SEAPORT BLVD | 48 |
| ALAMEDA DE LAS PUL | 46 |
| EDGEWOOD RD | 46 |
| MAIN ST | 46 |
| BREWSTER AV | 44 |
| JEFFERSON AV | 40 |
| MADISON AV | 40 |
| FARM HILL BLVD | 34 |
| BAY RD | 32 |
| BRADFORD ST | 32 |
| HOPKINS AV | 32 |
| HOOVER ST | 30 |
| MANZANITA ST | 30 |
| WALNUT ST | 30 |
| BLOMQUIST ST | 28 |
| VALOTA RD | 28 |
| Other | 426 |
2005 - 2018 National Fire Incident Reporting System (NFIRS) incidents
- Incident types reported to NFIRS in Redwood City, CA
- 15,10357.7%Rescue & EMS
- 2,61310.0%Good Intent Call
- 2,61110.0%Hazardous Condition
- 2,2108.4%Fire
- 2,0647.9%Service Call
- 1,5135.8%False Alarm
- 420.2%Overpressure Rupture
- 350.1%Special Incident
- Fire incident types reported to NFIRS in Redwood City, CA
- 95543.2%Structure Fires
- 70932.1%Outside Fires
- 37717.1%Mobile Property/Vehicle Fires
- 1697.6%Other
 Based on the data from the years 2005 - 2018 the average number of fires per year is 158. The highest number of fires - 251 took place in 2008, and the least - 42 in 2013. The data has a rising trend.
The average number of yearly fire incidents per 10k residents in Redwood City, CA compared to nearest cities:
(Note: Based on data for the last 3 years, including only cities with population 5,000 and above)
| Redwood City: | 23.3 |
| San Carlos: | 15.2 |
| Atherton: | 10.3 |
| Menlo Park: | 21.6 |
| Belmont: | 17.4 |
| Woodside: | 83.2 |
| Foster City: | 10.7 |
| East Palo Alto: | 20.3 |
| Stanford: | 21.7 |
 The median response time based on all reported fire incidents is 5 minutes. This is lower than the state median value.
The median response time in Redwood City, CA compared to nearest cities:
(Note: Based on data for all years, including only cities with at least 500 fire incidents)
| Redwood City: | 5 minutes |
| San Carlos: | 5 minutes |
| Menlo Park: | 4 minutes |
| Belmont: | 5 minutes |
| Foster City: | 4 minutes |
| East Palo Alto: | 4 minutes |
| San Mateo: | 4 minutes |
| Palo Alto: | 6 minutes |
| Burlingame: | 4 minutes |
 Based on the reports from the years 2005 - 2018 the average number of fire-related yearly casualties is 1. The highest number of casualties - 4 took place in 2006, and the lowest - 0 in 2007. The data has a constant trend.
The average number of casualties per 1,000 fire incidents is 7. This indicator was the highest - 24 in 2013, and the lowest 0 in 2007. The trend for casualties per 1,000 fire incidents is decreasing. Compared to the state value the number of injuries per 1,000 fire incidents is higher.
Based on the reports from the years 2005 - 2018 the average number of fire-related yearly casualties is 1. The highest number of casualties - 4 took place in 2006, and the lowest - 0 in 2007. The data has a constant trend.
The average number of casualties per 1,000 fire incidents is 7. This indicator was the highest - 24 in 2013, and the lowest 0 in 2007. The trend for casualties per 1,000 fire incidents is decreasing. Compared to the state value the number of injuries per 1,000 fire incidents is higher.Casualties per 1,000 incidents in Redwood City, CA compared to nearest cities:
(Note: Based on data for all years, including only cities with at least 500 fire incidents)
| Redwood City: | 6.8 |
| San Carlos: | 0.0 |
| Menlo Park: | 2.6 |
| Belmont: | 0.0 |
| Foster City: | 1.6 |
| East Palo Alto: | 6.1 |
| San Mateo: | 0.7 |
| Palo Alto: | 3.0 |
| Burlingame: | 4.7 |
 35.1% incidents where reported in the morning and 64.9% in the evening. The most fires (15.6%) took place on Saturday, and the least (12.9%) on Thursday.
 Based on the 2,210 fire incidents from years 2005 - 2018 most fires (12.4%) took place during June, and the least (5.4%) in November.
 Out of all 26,195 cases reported during the years 2005 - 2018, the most belonged to the categories: Rescue & EMS (57.7%), Good Intent Call (10.0%), and Hazardous Condition (10.0%).
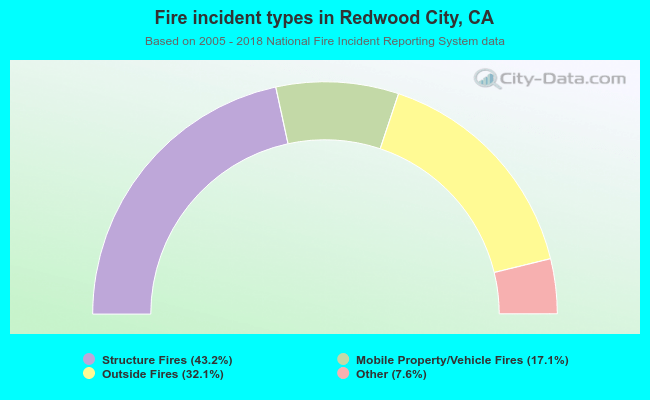 When looking into fire subcategories, the most incidents belonged to: Structure Fires (43.2%), and Outside Fires (32.1%).