| Fire incidents reported |
|---|
| Sreet name | Count |
|---|
| BEL FIRE TOWER RD | 36 | | 190 HWY | 20 | | 113 HWY | 16 | | HWY 190 | 14 | | LYLES ST | 14 | | MARTIN TRAM RD | 14 | | HWY 113 | 12 | | FORD ST | 10 | | CAMP PEARL LOOP | 8 | | TOPSY BEL | 8 | | BEL FIRE TOWER RD | 6 | | BUD REEVES RD | 6 | | CAMP PEARL RD | 6 | | COLE ST | 6 | | DAVID AVE | 6 | | MATERNE RD | 6 | | RODEO PEN RD | 6 | | TOPSY BEL RD | 6 | | WESTLAND | 6 | | ALBERT COLE RD | 4 | | BEASLEY RD | 4 | | CAMP PEARL LOOP | 4 | | CLARK AVE | 4 | | COW TRAIL RD | 4 | | DUNNEHOO RD | 4 |
| | | Fire incidents reported |
|---|
| Sreet name | Count |
|---|
| GETTY UP LN | 4 | | LAPOINT KINGREY RD | 4 | | LEGNON ST | 4 | | LYLES | 4 | | MALENE RD | 4 | | METHODIST CAMP | 4 | | OF HWY 1131 S OF BEL FIRE TOWE RD | 4 | | POE ST | 4 | | TEXAS EASTERN RD | 4 | | WALKER RD | 4 | | 1623 BEL FIRE TOWER RD | 2 | | 190 | 2 | | 2147 S LYLES ST | 2 | | 218 ALEXANDER ROAD | 2 | | ADAMS RD | 2 | | ALEXANDER | 2 | | ALEXANDER DR | 2 | | ALEXANDER DR | 2 | | ALLEN COLE RD | 2 | | AMANDA DR | 2 | | ANNIE REEVES | 2 | | ANNIE REEVES RD | 2 | | BARNES CREEK RD | 2 | | BARNES CREEK TOPSY BEL RD | 2 | | |
|
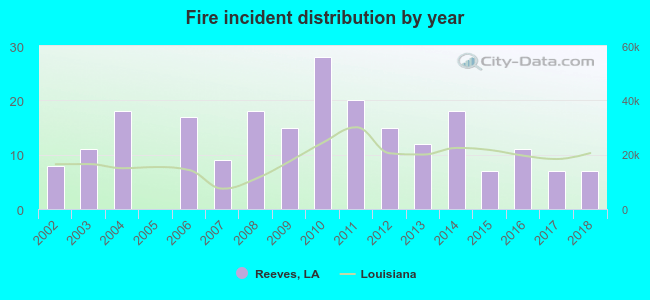 Based on the data from the years 2002 - 2018 the average number of fires per year is 13. The highest number of fires - 28 took place in 2010, and the least - 0 in 2005. The data has a dropping trend.
 18.6% incidents where reported in the morning and 81.4% in the evening. The most fires (21.3%) took place on Friday, and the least (9.5%) on Monday.
 Based on the 221 reports from years 2002 - 2018 most fires (22.2%) took place during March, and the least (2.7%) in November.
 Out of all 379 cases reported during the years 2002 - 2018, the most belonged to the categories: Fire (58.3%), Rescue & EMS (32.7%), and Hazardous Condition (4.5%).
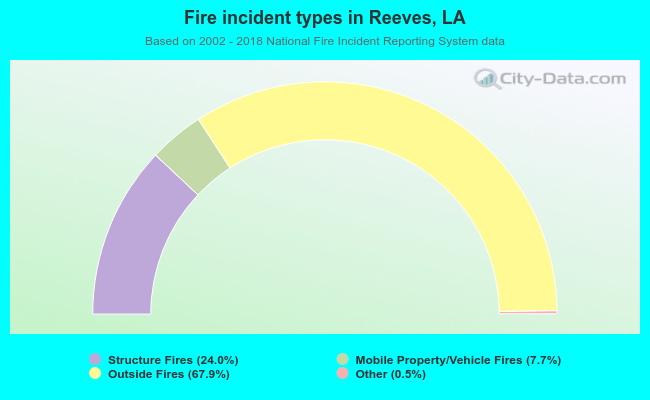 When looking into fire subcategories, the most incidents belonged to: Outside Fires (67.9%), and Structure Fires (24.0%).