| Fire incidents reported |
|---|
| Sreet name | Count |
|---|
| SHAMROCK AVE | 10 | | 110TH ST | 6 | | 150TH ST | 6 | | 160TH ST | 6 | | 200TH ST | 6 | | 230TH ST | 6 | | C38 | 6 | | L14 | 6 | | 165TH ST | 4 | | 19374 HWY 140 | 4 | | 3 1/2 S REMSEN HY 140 | 4 | | 315 JACKSON STREET | 4 | | BECK AVE | 4 | | C16/L12 1/2 EAST | 4 | | HWY 140 | 4 | | L12 | 4 | | MADISON ST | 4 | | PIONEER AVE | 4 | | WASHINGTON ST | 4 | | #1 TRAILER IN THEIL | 2 | | 1 1/2 SOUTH OF C38 ON POK | 2 | | 1/2 E L14 ON 160TH | 2 | | 1/2 N 150TH ON L14 | 2 | | 100 TH ST | 2 | | 100ST / PIONEER AVE | 2 |
| | | Fire incidents reported |
|---|
| Sreet name | Count |
|---|
| 10491 QUEST AVE | 2 | | 10621 L14 | 2 | | 107 FRANKLIN | 2 | | 10916 SHAMROCK AVE | 2 | | 110TH & SHAMROCK | 2 | | 120TH & ALMOND | 2 | | 120TH ST | 2 | | 122 430TH ST | 2 | | 12291 L22 | 2 | | 140 HWY | 2 | | 140 TH ST | 2 | | 140TH ST | 2 | | 15378 L14 | 2 | | 15491 SUNSET | 2 | | 15491 SUNSET | 2 | | 15502 POLK AVE / RES | 2 | | 15668 PIONEER AV | 2 | | 15996 QUEST AVE | 2 | | 160 ST | 2 | | 16311 L-12 | 2 | | 16442 SHAMROCK | 2 | | 17578 POLK AV | 2 | | 17708 HWY 140 | 2 | | 17727 ROOSEVELT AVE | 2 | | |
|
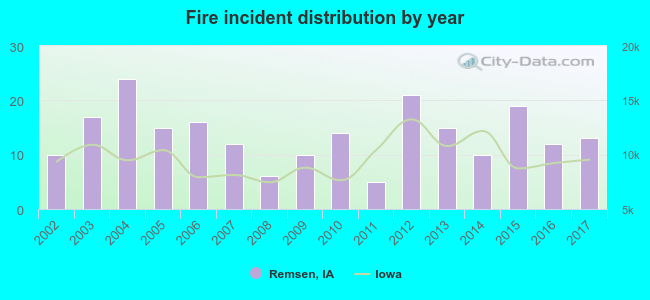 According to the data from the years 2002 - 2017 the average number of fire incidents per year is 14. The highest number of fires - 24 took place in 2004, and the least - 5 in 2011. The data has a rising trend.
 30.1% incidents where reported in the morning and 69.9% in the evening. The most fires (19.6%) took place on Friday, and the least (9.6%) on Wednesday.
 According to the 219 fires from years 2002 - 2017 most fires (16.4%) took place during April, and the least (2.7%) in December.
 Out of all 333 cases reported during the years 2002 - 2017, the most belonged to the categories: Fire (65.8%), Rescue & EMS (14.7%), and Hazardous Condition (5.7%).
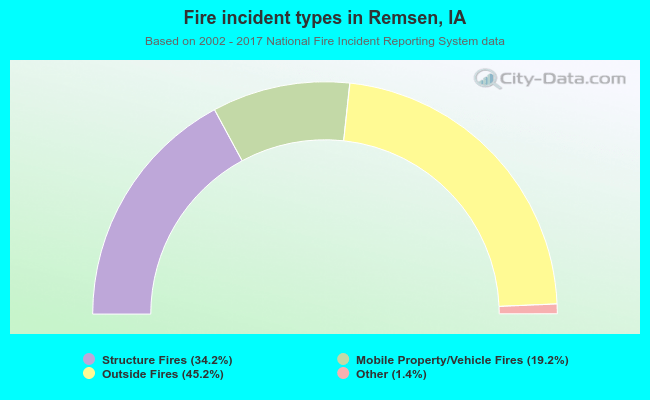 When looking into fire subcategories, the most incidents belonged to: Outside Fires (45.2%), and Structure Fires (34.2%).