Reynoldsville: Fire Incidents, Pennsylvania (PA)
Where are fire incidents reported in Reynoldsville, PA
Something went wrong! Please refresh the page.
|
| |||||||||||||||||||||||||||||||||||||||||||||||||||||||||||||||||||||||||||||||||||||||||||||||||||||||||||||
2004 - 2018 National Fire Incident Reporting System (NFIRS) incidents
- Incident types reported to NFIRS in Reynoldsville, PA
- 19237.9%Hazardous Condition
- 15029.6%Fire
- 8015.8%Rescue & EMS
- 458.9%Service Call
- 132.6%Good Intent Call
- 122.4%False Alarm
- 122.4%Severe Weather
- 10.2%Overpressure Rupture
- 10.2%Special Incident
- Fire incident types reported to NFIRS in Reynoldsville, PA
- 10872.0%Structure Fires
- 2516.7%Outside Fires
- 96.0%Mobile Property/Vehicle Fires
- 85.3%Other
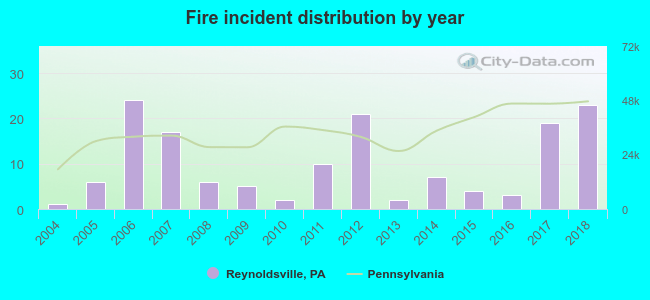 According to the data from the years 2004 - 2018 the average number of fires per year is 10. The highest number of fire incidents - 24 took place in 2006, and the least - 1 in 2004. The data has a growing trend.
 34.0% incidents where reported in the morning and 66.0% in the evening. The most fires (16.0%) took place on Tuesday, and the least (10.0%) on Monday.
 According to the 150 fire incident reports from years 2004 - 2018 most fires (19.3%) took place during January, and the least (2.0%) in October.
 Out of all 506 cases reported during the years 2004 - 2018, the most belonged to the categories: Hazardous Condition (37.9%), Fire (29.6%), and Rescue & EMS (15.8%).
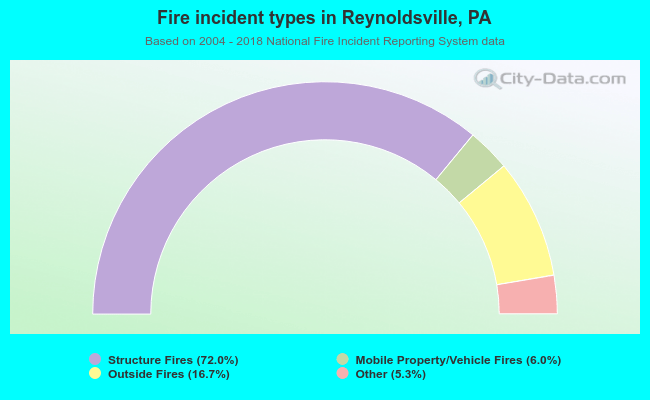 When looking into fire subcategories, the most incidents belonged to: Structure Fires (72.0%), and Outside Fires (16.7%).