Rice: Fire Incidents, Minnesota (MN)
Where are fire incidents reported in Rice, MN
Something went wrong! Please refresh the page.
|
| |||||||||||||||||||||||||||||||||||||||||||||||||||||||||||||||||||||||||||||||||||||||||||||||||||||||||||||
2002 - 2018 National Fire Incident Reporting System (NFIRS) incidents
- Incident types reported to NFIRS in Rice, MN
- 52050.1%Rescue & EMS
- 34633.3%Fire
- 726.9%Hazardous Condition
- 575.5%Good Intent Call
- 252.4%False Alarm
- 171.6%Service Call
- Fire incident types reported to NFIRS in Rice, MN
- 15143.6%Outside Fires
- 10229.5%Structure Fires
- 6719.4%Mobile Property/Vehicle Fires
- 267.5%Other
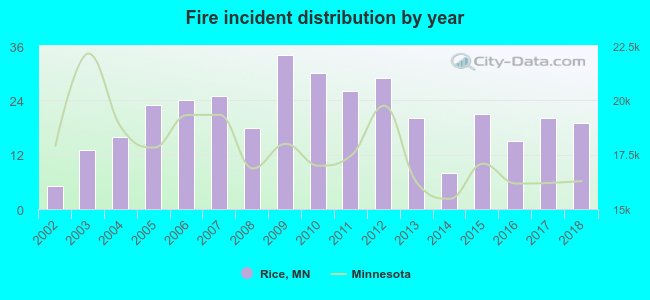 Based on the data from the years 2002 - 2018 the average number of fire incidents per year is 20. The highest number of reported fire incidents - 34 took place in 2009, and the least - 5 in 2002. The data has an increasing trend.
 Based on the data from the years 2002 - 2018 the average number of fire-related casualties per year is 0. The highest number of reported injuries - 1 took place in 2008, and the lowest - 0 in 2002. The data has a constant trend.
 30.1% incidents where reported in the morning and 69.9% in the evening. The most fires (16.8%) took place on Sunday, and the least (10.7%) on Tuesday.
 According to the 346 incident reports from years 2002 - 2018 most fires (17.6%) took place during April, and the least (3.5%) in February.
 Out of all 1,038 cases reported during the years 2002 - 2018, the most belonged to the categories: Overpressure Rupture (50.1%), Fire (33.3%), and Rescue & EMS (6.9%).
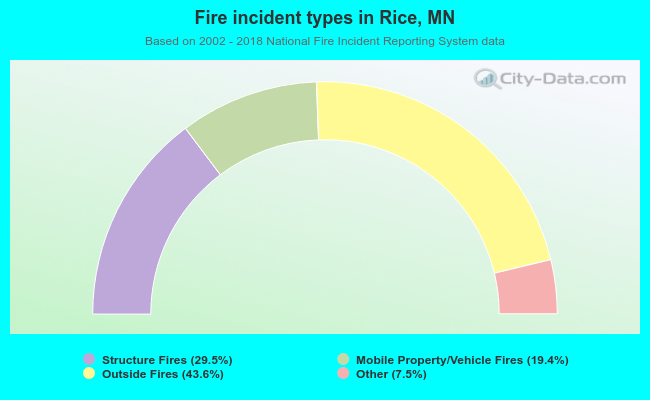 When looking into fire subcategories, the most incidents belonged to: Outside Fires (43.6%), and Structure Fires (29.5%).